Contents
Report 4 of the 08 May 01 meeting of the Professional Standards and Performance Monitoring Committee and provides information and commentary on homicide trends.
Warning: This is archived material and may be out of date. The Metropolitan Police Authority has been replaced by the Mayor's Office for Policing and Crime (MOPC).
See the MOPC website for further information.
Homicide performance
Report: 4
Date: 8 May 2001
By: Commissioner
Summary
This report provides information and commentary on homicide trends and MPS performance over the last three years. This includes information on the impact that individual operations and/or branches have made on homicide clear-up rates.
A. Recommendation
That Members note the contents of this report.
B. Supporting information
Target and objectives
1. The definition of homicide for the purpose of this report adheres to the national definition set by the Home Office. This includes a combination of offences recorded as murder, manslaughter or infanticide.
2. The MPS target for 2001/02 is to achieve a clear-up rate of 90 per cent with key objectives including:
- implementation of the specialist computer system Holmes 2 in all major incident rooms;
- develop a rational case assessment model to optimise resources;
- continue proactive tasking to reduce the rate of homicides;
- continue implementation of the forensic science strategy to build up resources and expertise in support of other serious crime investigations on boroughs;
- complete senior investigating officers (SIO's) training and ensure continued professional development.
Performance
3. The volume of homicides recorded by the MPS has displayed an increase over the last three years. However, this has not been a consistent ascent, for although in 1999/00 homicides were significantly higher than the end of year offences for 1998/99, 2000/01 has recorded a marginal reduction from last year.
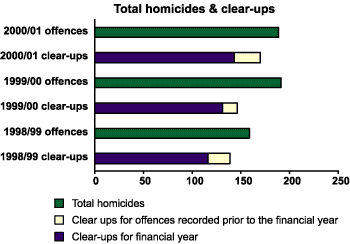
4. The chart below displays the annual number of homicides recorded since April 1998 and details the number of clear-ups achieved during that period. This has been further broken down in the chart to identify those clear-ups that relate to an offence committed within that financial year and those that relate to an offence prior to that period.

5. In 1998/99 there were 159 Homicides recorded by the MPS with a clear up rate of 87.4 per cent. In 1999/00 Homicides increased by 20 per cent to a total of 191 with a reduced clear-up rate of 76.4 per cent. Although 2000/01 continues the pattern by recording higher numbers of homicides compared with 1998/99, it actually displays a 1 per cent reduction from last year, with an accelerated clear-up rate of 89.9 per cent.
6. In 1998/99 23 clear-ups (16.5 per cent) obtained during this period, related to murders that were committed before April 1998. In 2000/01 this success was continued, clearing up 27 homicides (15.9 per cent) committed prior to the reporting year. By comparison, only 15 (10.3 per cent) clear-ups for crimes recorded in previous years were recorded in 1999/00.
Factors affecting performance
7. There are a number of contributing factors to the performance improvements seen in 2000/2001, and the varied success rates in clear-ups over the three years:
- in 2000/2001, the MPS established the Serious Crime Group (SCG) and committed significant resources to the investigation of homicide;
- the MPS has embarked on a programme of case reviews, re-examining unsolved murders to try to resolve them by making use of modern forensic techniques. As part of this MPS initiative in 2000/01 the Serious Crime Group (SCG) were given additional resources and support to assist in their investigations of murder cases;
- the new structure of SCG ensures correct reporting and counting is now in place for both the number of offences and the number of clear-ups. Where appropriate it also ensures that investigating units assist the team's re-visiting old investigations. As a consequence 25 homicides were recorded 'cleared up' by SCG during 2000/01, but which had been committed prior to April 2000;
- a further contribution was made to the clear up rate in 2000/01 by Operation Trident. This is a continuous MPS proactive initiative, responding to increasing violence and public concern within the black communities of London. Trident is focused on gun and drug crime that is resulting in murder and serious injury inflicted by black offenders on black victims. Operation Trident has been responsible for 2 clear-ups of the 10 homicides it had recorded in 2000/01;
- there are still a significant number of homicides, which the MPS has not cleared up, for example there were 26 shooting homicides in 1999/00, which tended not to be domestic and therefore will take longer to solve. This pattern may continue into 2001/02 since there were 27 shooting homicides recorded in 2000/01, which will take longer to solve;
- lower performance in previous years may also have been affected by data quality problems. This may have resulted in over counting homicides and under counting clear-ups in previous years. For example, the process for counting offences may have included homicides that were in fact 'no crime'*. Another possible reason for the fall in clear-ups in 1999/00 is a failure to record clear up data on the system in time to be counted in the reporting year.
*A 'no crime' occurs when an allegation 'fails to be proved as a homicide', which can be through insufficient evidence, a re-classification such as to ABH or the victim has been found to have died of natural causes.
Seasonal trends
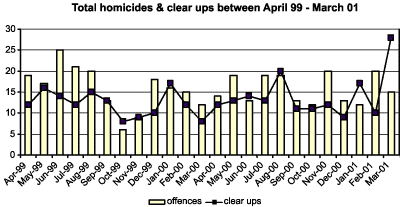
8. The chart below displays the monthly homicide trends between April 1999 and February 2001. It is not possible to breakdown 1998/99 figures by month, due to the changes made with the MPS data collation systems during that year.

9. There appears to be a seasonal trend evident in both years, where numbers begin to decrease from August through to November, when they again begin to climb. In 2000 however, the number of homicides begin to accelerate earlier during the month of November, rather than December, as was the case in 1999/00.
10. There are also a number of inconsistencies between the two years trends, specifically in the summer periods and the new year:
- during the summer of 1999/00 (June to August) the number of homicides peaked, recording above 20 offences in each month. June and July 1999 record the highest levels of offences throughout the two years. However this summer peak is not evident in 2000 and in fact June numbers decline rapidly from the previous months;
- as each New Year begins, a very inconsistent pattern emerges in 2001 unlike the stable pattern displayed in 1999/00. In 1999 (January-March) there is a steady fall in homicides at a continuous rate of 2/3 offences a month, whilst during this same period in 2001 figures move sporadically up and down by 5/8 offences. The start of the new financial year (April 2001) has recorded an accelerated number of homicides.
Conclusion
11. The end of year figure shows that 2000/01 recorded 189 homicides with a clear up rate of 89.9 per cent, which exceeded the 2000/01 target. The cold case review and SCG have gone a long way in increasing the clear-up rate due the improved skills and number of resources that have been made available. The number of older homicide cases that have been re-visited and cleared up is varied and it is therefore impossible to predict how many will be recorded in 2001/02.
C. Financial implications
None.
D. Background papers
None.
E. Contact details
The author of this report is Karen Turner, MPS Corporate Performance Analysis Unit.
For information contact:
MPA general: 020 7202 0202
Media enquiries: 020 7202 0217/18
Send an e-mail linking to this page
Feedback