Contents
Report 18 of the 11 Oct 01 meeting of the Professional Standards and Performance Monitoring Committee and provides an update on the level and type of public complaints made against the MPS.
Warning: This is archived material and may be out of date. The Metropolitan Police Authority has been replaced by the Mayor's Office for Policing and Crime (MOPC).
See the MOPC website for further information.
Public complaints against the MPS (quarterly update)
Report: 18
Date: 11 October 2001
By: Commissioner
Summary
This report provides an update on the level and type of public complaints made against the MPS and provides a breakdown of complaints “per 100 officers” by borough. The report summarises performance during 2000/01 and for the first quarter of 2001/02 (Apr - Jun).
A. Recommendations
Members are asked to note the report.
B. Supporting information
Historical performance - trends in complaint allegations
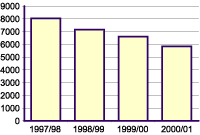
1. The number of public complaint allegations in 2000/01 reduced by 781 allegations (from 6611 in 1999/2000 to 5830) a reduction of 12% compared with the level in 1999/00. This continues the steady reduction in the annual level of complaint allegations over the past four years, and is illustrated in the following chart:
Public complaint allegations in the MPS
2. The Directorate of Professional Standard’s three-year plan has a number of reduction and preventative strategies in place that includes the shifting of resources from investigation to prevention and problem solving. It is however, probably too early to say whether these have had a direct impact on the reduction seen over the longer-term.
3. It should be noted that the MPS records within its figures those complaints relating to officers on secondment to Hertfordshire, Essex and Surrey constabularies. In 2000/01, there were 28 complaint allegations relating to seconded officers.
4. Allegations over the first quarter of 2001/02 (Apr - Jun) total 1377, and indicate that this lower level may be continued, although the reduction may be less than seen in 2000/01. This would however assume that allegations over the remainder of the planning year continue to be in line with those in the first three months.
5. The number of complaint cases reduced by 613 in 2000/01 (from 4399 in 1999/00 to 3786). This is a reduction of 14% and is over three times the reduction seen in the previous year (171). Cases over the first quarter of 2001/02 total 940, and at this stage appear likely to remain at a similar level as 2000/01.
6. Complaint cases will involve one or more allegations, and the ratio of allegations to cases has remained at 1.5 : 1 during 2000/01 and the first quarter of 2001/02.
Types of complaint allegations
7. The following chart shows the breakdown of allegation categories in 2000/01. Details of the allegation types within each category are in Appendix 1:
Breakdown of recorded complaint allegations according to Home Office categories 2000/2001
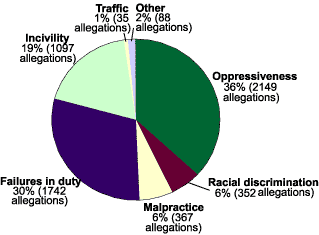
8. During the 2000/01 planning year the majority of allegation categories reduced in line with the overall reduction in allegations. The exceptions to this related to complaint types within the category of Failures in Duty (see Appendix 1) and were:
- Failures in duty Code A (stop and search) increased by 16 allegations (last year 102 - this year 118). This made up 2% of allegations recorded in 2000/01 compared to 1.5% the previous year.
- Failures in Duty Code C (detention, treatment and questioning) increased by 36 allegations (last year 205 - this year 241). This was 4% of allegations in 2000/01, compared to 3% the previous year.
- Failures in Duty Code D (identification procedures) 2 allegations in 2000/01; none in the previous year.
9. Complaint allegations in the first quarter of the current year have maintained broadly the same proportions as 2000/01.
10. A previous report to PSPM highlighted the increase in offences of racially discriminatory behaviour between 1997/98 and 1999/00. The percentage of these allegations recorded in 2000/01 dropped by 16% compared to the previous year, remaining at 6% of the total number of allegations recorded in each year. In the first quarter of the current year the proportion is broadly similar, at 5%.
Complaints following stop and search
11. The report prepared for the April meeting looked in detail at the performance indicator introduced this year to monitor the number of complaint allegations made by people who had been involved in a stop and search.
12. During 2000/01, complaint allegations by minority ethnic people who were stop/searched made up 0.36% of all minority ethnic people stop/searched, and complaint allegations by white people stop/searched made up 0.19% of white people stop/searched. For the first quarter of 2001/02 these percentages are 0.31% and 0.11% respectively.
13. For the first quarter of 2001/02, there has been 91 allegations, made by 60 complainants. Of these, 64 allegations (70%) were made by minority ethnic people, and 25 by white people (27%). This compares with proportions of 54% and 38% respectively in 2000/01. Two further allegations in the first quarter were recorded (2%), however the complainant ethnicity is not known. In 2000/01 this proportion was 8%.
14. Stop and search complaint allegations for the first quarter of 2001/02 are below the rate for last year, and if this continues, the year total is likely to be considerably below the 2000/01 number. This reduction relates mainly to complaints by white people. The number of complaints by minority ethnic people however have stayed at roughly the same level, and this accounts for the changes in proportions referred to in the last paragraph.
Analysis of complainants
15. The previous reports to PSPM noted the increase in the proportion of female complainants between 1997/98 (26%) and 2000/01 (31%). This trend does not appear to have continued into 2001/02, with the proportion of female complainants in the first quarter being 29%.
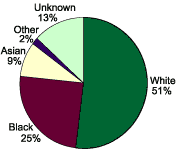
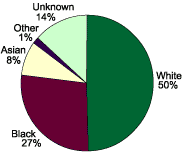
16. The following charts show the proportion of complainants by ethnic groups. Although the changes have been marginal, there has been a gradual increase in the proportion of black complainants - 23% in 1999/00 to 25% in 2000/01 to 27% in first quarter 2001/02. It should be noted however that although the proportion of black complainants has increased, this in fact represents a reduction in the number of black complainants between 1999/2000 and 2000/01. This reduction is however less than that shown for all complainants.
Breakdown of complainants by ethnicity 2000/2001
Breakdown of complainants by ethnicity 2001/2002
(1/4/01-30/6/01)
Complaints at borough level
17. The following information has been included in response to a request for complaints data at borough level. It should be noted that the number of allegations referred to here will be greater than the count at allegation level, as complaints data shown by boroughs/units are counted at officer level. Since a complaint case can comprise of one or more allegations against one or more officers, results will be different depending on the level at which the complaints are counted (in this example, at allegation level or officer allegation level). An officer allegation is an allegation or allegations, made by one or more complainants that has been counted against all of the officers who are subject of that allegation (and have been notified of such). In practice, allegations counted at officer level are just under double the number counted at allegation level.
18. The chart below shows complaints “per 100 borough officers” for the twelve months to June 2001. This highlights the boroughs of Enfield and Redbridge as having a high level of complaints per 100 officers.
19. Enfield and Redbridge had both been recognised by the Directorate of Professional Services (DPS) as key boroughs in terms of the level of complaints. Enfield, in consultation with DPS, has produced a 6-point action plan to reduce the level of complaints. The action plan has been put into place this summer, and includes improved supervision of operational policing. Good practise from other borough action plans has also been applied at Redbridge.
20. Enfield, along with Newham, Merton, Brent, Paddington, Haringey, Tower Hamlets and SO5 are piloting a system which allows boroughs direct access to DPS complaints data over OTIS (following a rigorous authority and audit process). This enables nominated officers on borough to analyse their borough data and where necessary, lead to early management intervention on behalf of the borough commander.
Complaints by borough* - per 100 officers, rolling year ending June 2001
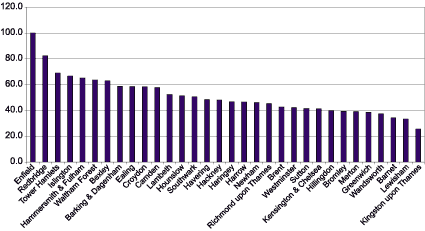
21. It should be noted that the data in the above chart relates only to officers on the 32 boroughs. Allegation data relating to all other units and HQ branches (e.g. Territorial Support Group, Traffic, SO officers) amounts to around 18% (1781) of the total number of officer allegations over the rolling year to June 2001.
Outcome of allegations
22. Analysis across all allegations outcomes shows the following (1999/00 figures are shown for comparison):
|
Outcome of allegations |
First quarter |
2000-2001 |
1999-2000 |
|||
|---|---|---|---|---|---|---|
|
Information resolution |
372 |
29% |
1831 |
31% |
2135 |
31% |
|
Withdrawn |
182 |
14% |
810 |
14% |
1124 |
16% |
|
Dispensation |
349 |
27% |
1635 |
28% |
1771 |
26% |
|
Unsubstantiated |
344 |
27% |
1463 |
25% |
1635 |
24% |
|
Substantiated |
33 |
3% |
138 |
2% |
168 |
2% |
|
Full investigations* |
377 |
9% |
1601 |
9% |
1803 |
9% |
23. The number of substantiated allegations as a percentage of full investigations have been added to the table. A “full investigation” is regarded as one where an Investigating Officer has been appointed and considered the evidence sufficiently to enable the outcome of each allegation to be either substantiated or unsubstantiated.
24. The proportion of the total relating to each outcome has remained broadly similar since 1999/00, with the greatest change being a gradual, although small, increase in the number of unsubstantiated complaints.
25. Overall the number of allegations completed in 2000/01 compared to the previous year has decreased by 956 allegations (14%), from 6833 allegations to 5877 allegations.
C. Financial implications
None arising from this report
D. Background papers
- PSPM paper 01/04 - Public complaints against the MPS (9 January 2001)
- PSPM paper 01/21 - Public complaints against the MPS (10 April 2001)
E. Contact details
Report authors: Lesley Nichols, MPS Corporate Performance Analysis Unit (020 7230 3638) and Michael Clark, MPS Directorate of Professional Standards
For information contact:
MPA general: 020 7202 0202
Media enquiries: 020 7202 0217/18
Home Office allegation categories
These are divided as follows:
- Oppressiveness:
- Serious non-sexual assault
- Sexual assault
- Other assault
- Oppressive conduct / harassment
- Unlawful / unnecessary arrest or detention
- Racially discriminatory behaviour
- Malpractice:
- Perjury / irregularity in relation to evidence
- Corrupt practice
- Mishandling of property
- Failures in duty:
- Breach code A (stop and search)
- Breach code B (searching premises and seizure of property)
- Breach code C (detention, treatment and questioning)
- Breach code D (identification procedures)
- Breach code E (tape recording)
- Multiple/unspecified breaches that cannot be allocated to other codes
- Failures in duty / other neglect
- Other irregularity in procedure
- Incivility
- Traffic irregularity
- Other
Results
The outcome of complaints will fall into one of the following categories:
- Substantiated
- Unsubstantiated
- if after full investigation there is insufficient evidence to substantiate the complaint - Informal resolution
- complaints are suitable for informal resolution only if the conduct complained of would not justify a criminal charge or misconduct hearing and the complainant is happy for it to be handled in this way. - Withdrawn or not proceeded with
- Dispensed with by Police Complaints Authority (PCA)
- as incapable of investigation. Complaints are resulted in this way following a request that the PCA grant a dispensation from the requirement to investigate the complaint. The most common reason for this is due to lack of co-operation from the complainant.
Send an e-mail linking to this page
Feedback