Contents
Report 12 of the 17 Jul 03 meeting of the Equal Opportunities & Diversity Board and summarises long-term trends in terms of racist and homophobic crime, volume and performance within the MPS over the previous five financial years.
Warning: This is archived material and may be out of date. The Metropolitan Police Authority has been replaced by the Mayor's Office for Policing and Crime (MOPC).
See the MOPC website for further information.
Long term trends in racist and homophobic crime performance
Report: 12
Date: 17 July 2003
By: Commissioner
Summary
This report summarises long-term trends in terms of racist and homophobic crime, volume and performance within the MPS over the previous five financial years, 1998/99 to 2002/03 inclusive. In addition, overall MPS trends by gender and ethnicity are detailed. Possible explanations are given for trends.
A. Recommendations
Members are asked to note the report.
B. Supporting information
1. This report contains information about trends in both racist and homophobic incidents. The first part of the report addresses racist incidents. The second part addresses homophobic incidents.
MPS Racist Crime Performance Trends
2. MPS corporate targets for racist crime were introduced in 2001/02, with targets predominantly based on judicial disposal (JD) rates. In 2001/02 the MPS target was to achieve a racist crime judicial disposal rate of 17%, with the target rising to 18% in 2002/03.
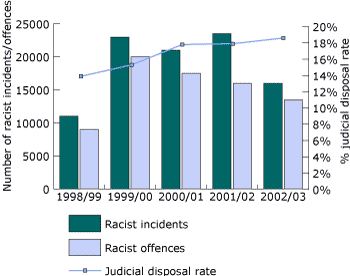
3. During 2002/03 the racist crime JD target was achieved with an 18.6% judicial disposal rate. This is a significant improvement on the MPS percentage rates achieved over the previous four financial years.
4. Over the five year period 1998/99 to 2002/03, the MPS achieved a significant increase in the racist crime JD rates. The JD rate 13.8% achieved during 1998/99 has constantly increased, rising to 18.6% in 2002/3.
5. A 110% increase in racist crime incidents is evident specific to years 1998/99 and 1999/00. From then onwards yearly racist incident and offence totals have fallen steadily. Specifically, between 1999/00 and 2002/03 there has been an overall reduction in terms of recorded racist incidents 32.4% and a 32.0% reduction in racist crime offences. However, current levels remain significantly above the total incidents and offences recorded in 1998/99.
6. Chart 1 details the judicial disposal rates achieved since 1998/99. In addition, the number of racist crime incidents and offences recorded over the period are also illustrated.
Chart 1: MPS racist incidents, offences and judicial disposal rates: 1998/99 to 2002/03
7. An examination of specific crime categories over the five-year period suggests that the specific categories Violence Against The Person (VAP) and Criminal Damage have accounted for higher proportions of racist offences.
8. Furthermore, the only offence category to display significant shifts since 1998/99 is the VAP category, accounting for 69% of all racist offences in 1998/99 to 78% in 2002/03. However, it should be noted that VAP is a broad category encompassing a number of individual crime types, including GBH, ABH, Common Assault and Harassment.
Racist Crime and Borough Performance
9. An examination into borough performance indicates that over the last five financial years the number of racist offences recorded within each borough has been somewhat changeable, with a few boroughs consistently recording the largest reductions in offences year on year.
10. For example, although numerically lower than a number of other boroughs Croydon actually recorded the greatest % increase, 9.1% during 2002/3. The previous year this borough actually recorded the second largest reduction with a decrease of 41.0% in racist offences.
11. This is the first time that data have been collated in this way and they have raised a number of questions. For example, Southwark recorded a decrease of 40.9% in reported racist offences in 2002/3, whereas Tower Hamlets recorded a 7% increase.
12. Specific to 2002/03 racist crime judicial disposal rates varied significantly between boroughs, from 32.1% in Haringey to 9.9% in Tower Hamlets. This is a greater variation than that demonstrated in previous years. However, any immediate conclusions should be balanced with the fact that some boroughs which, may be assessed as not performing as well, actually recorded significantly more offences over the period. We feel that the figures are disguising underlying factors that should be exposed and addressed.
13. To ensure that the picture presented by data is as accurate as possible we propose to carry out analysis of reporting and JD rates at Southwark and Tower Hamlets to establish what exactly the statistics are telling us. It is possible, for instance, that a three year plan to reduce repeat victimisation in Southwark has had significant impact on recorded crime. However, there may be other explanations. The results of the analysis will enable action plans to be designed that will support boroughs where necessary.
14. Overall a total of eighteen boroughs still achieved the corporate MPS JD target during 2002/03, an improvement when compared to fifteen boroughs the previous year. The analyses of the two boroughs will provide information to assist bring all other boroughs up to the standard required by MPS targets.
Possible explanations for trends
15. The MPS over the last five years has achieved a significant increase in the racist crime JD rates, which have risen from 13.8% in 1998/99 to 18.6% in 2002/03. Over the five-year period, MPS JD rates have demonstrated constant yearly increases.
16. From 1999/00, overall offence totals have been subject to a constant yearly downward trend however current yearly levels, still remain 47% above racist offence levels recorded during 1998/99.
17. The Racial and Violent Crime Task Force was first established in 1998. This and the publicity surrounding the publication of the Stephen Lawrence Inquiry report almost certainly led to the increase of reporting seen in 1999/2000.
18. The Task Force initiated high profile internal and external strategies that have continued over the five-year period to encourage victims to report crime and ensure better internal recording. Recent strategies include the ‘Cut out Hate Crime’ campaign launched during November 2002 and more recently various faith/hate crime strategies including poster campaigns launched during the 1st Quarter period 2003.
19. In addition to encourage reporting, a recent MPS police notice, 44/02 was published during November 2002 with regard to third party reporting. There are now over 134 sites operational throughout the MPS. 1% of racist offences are reported by third party means. A dedicated MPS intranet site containing corporate reporting forms and posters supports this initiative. These schemes form part of the considerable efforts of all boroughs to improve reporting of racist incidents.
20. Significant efforts have been demonstrated by the MPS in order to encourage reporting and pro-actively capture unreported offences, even though offence levels appear to have decreased. The possibility that the MPS is gradually gauging a truer crime level should not be discounted. It is also suggested racist crime investigation has become more focused, as in contrast to the decrease in offences JD rates continue to increase. All boroughs have hate crime in their Crime and Disorder strategies. In this context, ‘hate crime’ means racist and homophobic incidents and domestic violence.
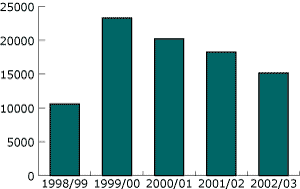
21. In terms of investigation for example, for some time each London Borough has an established Community Safety Unit (CSU) providing a dedicated investigative focus for hate crimes. Minimum standards in support of the investigation for such crimes have been re-evaluated and enhanced over the period and are currently undergoing review.
22. In terms of prevention, other investigative support strategies include the delivery of best practice for strategic responses to critical incidents, the guide to Managing and Preventing Critical Incidents is now on its 5th edition. Further aspects promoting hate crime prevention include a the 4th version of Operation Athena-Spectrum with new material, currently due for circulation.
23. Whilst offences have decreased, an ongoing pro-active MPS Reassurance Strategy (implemented post Sept 11th) may have impacted or deterred potential crime incidents. The reassurance activity identified places assessed as being highly vulnerable and/or attractive to international terrorism or those targeting particular faith groups. High visibility policing was employed as a tactic, particularly near Mosques and Gurdwaras. This may have had an unquantifiable impact on other crime, including racism. In addition, co-ordinated intelligence approaches across all levels has assisted more effective targeting of resources and support services.
24. Crime levels may have been impacted by way of the MPS embedding a significant number of hate crime strategies over the period. All Stephen Lawrence Inquiry recommendations are all being implemented, of the 39 that relate to policing, 26 are complete and the remaining 13 are being actively progressed. A further six recommendations are classed as complete.
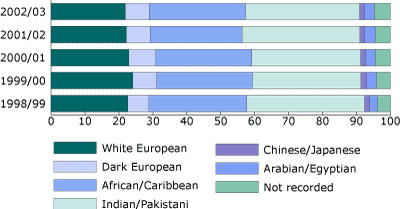
25. Historically, policing operations, were detailed as an MPS target for the period of two financial years. Both targets, with regard to the number of pro-active hate crime operations were significantly achieved during both years in question.
26. Hate crime pro-activity, however is no longer addressed as an MPS target due to specific issues encountered around clarity and measurement.
27. The fact that policing operations are not addressed by way of an MPS target has not diminished MPS hate crime pro-activity. Co-ordinated responses have continued over the period in question, as demonstrated by a number MPS wide Athena days, including a dedicated day during November 2002, which led to 99 arrests for hate crime offences. In addition, a number of boroughs have also undertaken independent borough-wide initiatives including Merton and Newham.
28. During 2002/03, the MPS Diversity Directorate (DCC4) initiated 78 Pro-active Assessment Taskings, in support of seventeen boroughs. In total 86 pro-active initiatives were worked upon by DCC4, and 39 arrests were made. An associated 1664 intelligence reports were developed as a result. These, statistics do not include independent borough based initiatives or MPS Met-wide pro-active days.
MPS Faith Hate Crime Category, Trends and any impact on Racist Crime figures
29. From 17 December 2001, the MPS implemented a system to record faith hate incidents. A faith hate incident is defined as follows
“Any incident that is perceived to be motivated by faith or religious hatred by the victim or any other person”
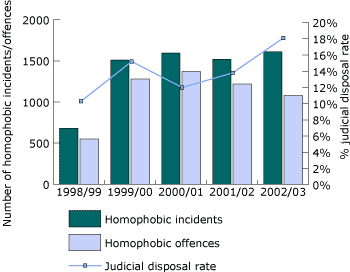
30. Since January 2002, the MPS has embedded a crime flagging system to enable particular faith crime types to be monitored. This flag FH is now applied to all Faith related crimes and incidents.
31. MPS Police Notice 2 - 2002, Item 4 relates to policy introduced in relation to the use of the FH flag and separate faith markers. MPS Police Notice 32 – 2002, Item 1 detailed the effect of legislation on racially or religiously aggravated offences. MPS faith crimes are now continuously monitored and promoted by way of various internal strategies and external media strategies.
32. As with all facets of hate crime, the MPS have demonstrated significant commitment to faith issues by way of an ongoing Community Involvement Strategy, partnerships and active participation with various faith groups.
33. Strategic relationships and formal links have been established with groups representing the Hindu, Jewish, Muslim and Sikh communities.
34. During 2002/03 there were 261 recorded offences of faith hate crime, with almost 65% of these resulting in the broad offence category of ‘Violence Against the Person’ (VAP), and 30% from Criminal Damage. Whilst the introduction of this field appears to have had negligible impact on the overall number of recorded racist crime offences, with faith hate crime accounting for 1.9% of all racist offences, the potential community impact attached to such crimes is not underestimated.
35. Whilst the recorded faith offence total may appear to be low, an ongoing pro-active MPS Reassurance Strategy (implemented post Sept 11th) may have impacted or deterred potential crime incidents. Deployments include reassurance visits to vulnerable premises, including places of worship, and High Visibility Patrols (HVPs).
36. Our contacts with faith groups provide anecdotal evidence of high levels of under-reporting of crime, particularly in Muslim communities. A series of campaigns, focused on Mosques, have been initiated jointly by DCC4 and the Muslim Safety Forum.
An Examination of Victims of Racist Crime
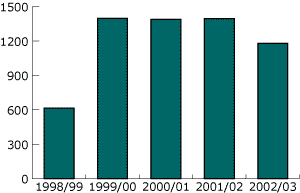
37. In line, with decreases in numbers of racist offences, since 1999/00 the number of victims reporting racist crimes has followed a similar downward trend. Chart 2 provides an illustration of this pattern.
38. When this data is broken down to incorporate the characteristics of victims, the proportions of male and female victims of racist crime has remained consistent over the last five financial years, with just under 60% of victims being male.
39. Examining the age ranges of such victims over the last five years indicates that individuals aged between 18-24 and 10-17 years are more likely to be a victim of racist crime.
40. In 2002/3 specifically there were approximately 3.00 racist crime victims per 1000 of the 18-24 population, 2.98 victims aged 25-44 per 1000 of this population age group and 2.62 victims aged between 10-17 per 1000 of this population age-group. The victimisation rate declines to under 2 victims per 1000 population for individuals aged the over 45.
Chart 2: The number of racist crime victims: 1998/99 to 2002/03
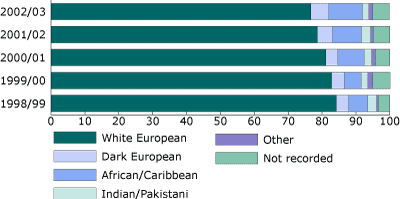
41. A further breakdown into the ethnicity of victims of racist crime indicates that the largest proportion of recorded victims are of the Indian / Pakistani ethnicity victim category. Chart 3 illustrates a breakdown of the ethnicity of racist crime victims for the last five financial years.
42. As illustrated, over the last five years Indian and Pakistani victims consistently account for approximately one third of all victims of racist crime, followed by African-Caribbean victims who consistently account for above one quarter and White victims who account for around one fifth of all racist crime victims. The proportion of victims of each ethnic group reporting racist crime has remained relatively stable since 1998/99.
Chart 3: Proportion of victims of racist crime by ethnicity
The Public Attitude Survey
43. To gain a greater understanding of the levels of racist crime in London, it is necessary to examine results of the Public Attitude Survey (PAS) alongside the MPS police recorded crime data. The PAS is an annual survey carried out independently which examines the attitudes of residents living in London.
44. The survey measures Londoners’ perceptions of policing needs, priorities and experiences, regardless of their level of police contact. It is believed that the PAS count of crime will provide an additional picture of crime which is unaffected by levels of reporting to the police and changes to police reporting guidelines.
45. The % of PAS respondents who said they had been victim of a racist attack or form of racist harassment has been stable at 1%. However, this is not a sensitive enough measure to indicate whether the fall in incidents relates to an actual fall or is related to recording practice.
MPS Customer Satisfaction Survey
46. The MPS also commissions a quarterly Customer Satisfaction Survey, with one aspect of this examining the satisfaction levels of victims of racially motivated crime. Annual returns from this survey indicate that the proportion of satisfied racially motivated victims has fallen slightly each FY, from 73.1% in 2000/1 to 67.5% in 2002/3. This reduction is in contrast to the reduced satisfaction levels for victims of all crime, which fell from 79.7% in 2000/1 to 76.4% in 2002/3.
MPS Homophobic Crime Performance Trends
47. The MPS initially included Homophobic Crime within its corporate targets in 2001/02. Targets are based on Judicial Disposal (JD) rates. During 2001/02 the MPS target for homophobic crime was to achieve a JD rate of 14%, with the target rising to 16% in 2002/3.
48. During the last two financial years, these MPS targets have been achieved, with a 15.3% JD rate demonstrated in 2001/2 and 18.0% JD rate in 2002/3. Chart 4 details MPS JD rates achieved since 1998/99. Homophobic incident and offence totals over the corresponding period are also illustrated.
Chart 4: MPS homophobic incidents, offences and judicial disposal rates: 1998/99 to 2002/03
49. As illustrated, following on from a significant rise in homophobic incidents and offences between 1998/9 and 2000/01, there has been a gradual decrease in recorded yearly totals. Specifically, between 2000/01 and 2002/03 there has been a 14.1% reduction in homophobic incidents and decrease of 20.3% in homophobic offences. However, any decreases should be taken in the context that current 2002/03 offence levels remain 100.6% above reported 1998/99 levels.
50. When examining major crime categories, flagged Homophobic, since 1998/99, the ‘Violence Against the Person’ (VAP) offences have consistently accounted for the majority of all homophobic crimes.
51. In addition, the proportion of homophobic offences classified as VAP has increased year on year, from 66.7% of all homophobic offences in 1998/99 to 74.4% in 2002/03. However the VAP category is broad and encompasses a number of crime categories, including for example GBH, ABH, Common Assault and Harassment offences.
52. Since 2000/01, the MPS has achieved a significant increase in the JD rates recorded for homophobic crime, rising from 11.2% in 2000/1 to 18.0% in 2002/3.
Homophobic Crime and Borough Performance
53. An examination of borough performance indicates that identifying trends from homophobic incidents data recorded in boroughs each year is somewhat unreliable. This is mainly due to the relatively small number of homophobic offences recorded per year.
54. Nevertheless, an examination into the total number of homophobic offences recorded in each borough indicates that since 1999/00 Westminster, Lambeth and Southwark boroughs have consistently recorded the largest number of homophobic offences within the MPS. This is probably because of the highly visible LGBT communities in these boroughs. Furthermore, since 1999/00 these specific three boroughs have accounted for over a quarter of all homophobic offences recorded pan-London. This may be explained by particular initiatives on these boroughs that may have increased reporting of incidents to police – e.g. reassurance campaigns in Westminster following the bombing of The Admiral Duncan and the first LGBT liaison officer established on a borough at Lambeth.
55. Due to the relatively small number of homophobic offences recorded within each borough, JD rates also vary significantly, both between boroughs and within each borough year on year. No borough has consistently recorded the highest homophobic JD rates, over the previous two financial years.
56. Overall a total of nineteen boroughs achieved the corporate MPS target in 2002/3, an improvement when compared to seventeen boroughs in 2001/2.
Possible explanations for falling trends
57. Over the five-year period, the MPS has generally achieved a steady increase in homophobic crime JD rates. Since a one-year downturn specific to 2000/01, the yearly increase has remained constant and the MPS rate achieved stands currently 6.8% above the rate achieved in 2000/01.
58. Whilst, recorded incidents and offences have been subject to a constant yearly downturn since 2000/01, current levels remain 100% above levels displayed in 1998/99.
59. High profile internal and external strategies have continued over the five-year period to both encourage victims to report crime and ensure better internal recording. Recent strategies include the ‘Cut out Hate Crime’ campaign launched during November 2002 and more recently an operational LGBT (Lesbian, Gay, Bi-Sexual and Transgender) Third Party Reporting Strategy is co-ordinated MPS wide by the Diversity Directorate. There have also been high profile local campaigns to increase reporting – e.g. Southwark, Waltham Forest and Hackney. 1.4% of all homophobic incidents are reported by third party schemes.
60. It is appropriate to note the contribution of the Lesbian Gay Bisexual Transgender Advisory Group. Members have advised on third party reporting schemes and, in one case, personally patrol cruising grounds to assist build trust and confidence of gay men in police. In addition, their guidance on the role of LGBT-LOs (see next paragraph) has also been invaluable. Members have also advised on critical incidents.
61. Dedicated LGBT liaison officers have been now been established within each borough. Dedicated Homophobic Crime intelligence tagging markers and LGBT Crime Flags are monitored on a daily basis and promoted regularly in order to enhance internal awareness and improve recording. Enhanced central and local monitoring also has enabled more effective intelligence co-ordination across all levels. The inclusion of an LGBT section with in the MPS diversity handbook, will assist also assist front line police officers in ensuring that they deal with the LGBT communities with greater sensitivity and awareness.
62. As with all hate crimes, significant efforts have been demonstrated by the MPS in order to encourage reporting and pro-actively capture unreported offences, even though offence levels appear to have decreased.
63. CSUs, referred to above, are responsible for investigating homophobic crime, as part of their broader ‘hate crime’ remit.
64. Whilst offences have decreased, an ongoing pro-active MPS Reassurance Strategy (implemented post Sept 11th) may have impacted or deterred potential crime incidents by directing HVP to high profile venues – e.g. Soho and its environs.
Detail of any policing operations currently being carried out planned
65. As stated above, hate crime pro-activity is no longer addressed as an MPS target due to specific issues encountered around clarity and measurement.
66. During 2002/03, the MPS Diversity Directorate (DCC4) initiated 78 Pro-active Assessment Taskings, in support of seventeen boroughs. In total 86 pro-active initiatives were worked upon by DCC4, and 39 arrests were made. The arrests were for a wide range of offences, not necessarily hate crime. Prosecution of hate crime is, sometimes difficult, because of reticence of witnesses and victims. We have found, however, that hate criminals are frequently involved in other types of criminality that makes them subject to the criminal justice process. An associated 1664 intelligence reports were developed as a result, including homophobic crime reports. These, statistics do not include independent borough based initiatives or MPS Met-wide pro-active days.
An Examination of Victims of Homophobic Crime
67. Between 1999/00 and 2001/02 the number of victims reporting homophobic crimes has remained stable year on year. However during the last financial year, 2002/3 specifically, the number of homophobic victims has reduced by 15.6% on the number recorded in 2001/02. Chart 5 provides some illustration of these patterns.
Chart 5: The number of homophobic crime victims: 1998/99 to 2002/03
68. A breakdown of this data in order to incorporate the characteristics of victims of homophobic crime, reveals the proportions of male and female victims of homophobic crime have remained consistent over the last five financial years, with over three quarters of victims being male.
69. An examination of the age ranges of such victims indicates that since 1998/99 individuals aged between 25 to 44 years have been most likely to report being a victim of homophobic crime. In 2002/03 there were 0.29 victims of homophobic crime per An 1000 of the 25 to 44 population.
70. The 18-24 year age group recorded the second largest number of victims, with 0.25 victims per 1000 of this corresponding population age-grouping. Both of these patterns were displayed during each of the previous five financial years
71. A further breakdown, in terms of the ethnicity of victims of homophobic crime indicates that since 1998/99 the largest proportion of such victims has significantly been of White-European ethnicity classification. Chart 6 illustrates a breakdown of the ethnicity of homophobic victims for the last five financial years.
72. Since 1998/99 the proportion of African-Caribbean homophobic victims has increased, from 5.7% of all homophobic victims in 1998/99, to 9.9% in 2002/03. In turn, the proportion of White-European homophobic victims has fallen from 84.2% of all homophobic victims in 1998/99 to 76.7% in 2002/03. It is difficult to establish the reasons for the increase of African-Caribbean victims without further research. It may be that the activities of the MPS in response to the Stephen Lawrence Inquiry has increased confidence of black and minority ethnic communities, including LGBT people in these communities.
Chart 6: Proportion of victims of homophobic crime by ethnicity
MPS Crime Victim Survey
73. The MPS commissions a quarterly Crime Victim Survey (CVS). This is a telephone survey of crime victims and covers questions with regard to satisfaction in terms of initial police response and other factors such as method of contact with the police and satisfaction with the service received. The survey also covers the behaviours of the officers and the types of information / advice offered to the victim.
74. The sample for the CVS is extracted from the MPS Crime Report Information System (CRIS), and contacts victims who have been flagged as suitable for surveying once a number of defining criteria have been fulfilled. 100 crimes victims per borough per quarter are surveyed.
75. From April 2003 a sample of homophobic crime victims have been collated, with the first set of results for these victims expected around August 2003. However, it should be noted that the small number of victims suitable for interviewing could limit this sample, thus the MPS aims to interview 100 homophobic crime victims per quarter for the entire MPS.
C. Equality and diversity implications
The way in which crimes impacting on particular groups are dealt with carries significant influence on the relationship between the police and these groups. It is essential that the MPS continues to monitor performance data in this area and consistently act upon results in a proportionate, legal, accountable and necessary manner. The MPS are committed to addressing Equality and Diversity across all levels, and amongst other factors community impact is monitored, assessed and addressed by way of an ongoing community involvement and reassurance strategy.
The MPS believes that its approach to racist and faith hate incidents assists to fulfil its obligations under the Race Relations (Amendment) Act. Activity to target people who commit this type of crime is effective in improving JD rates. By reducing the number of racist and faith hate incidents and by prosecuting those who commit these types of offences, we improve relations between races.
D. Financial implications
Significant funding has been appropriated to support MPS Equality, Diversity and Hate Crime approaches ranging from training to investigation, across all levels. Many budgets have been incorporated into mainstream or departmental work and hence are not quantifiable, however existing evidence strongly supports this statement including ongoing progress monitoring strategies.
In terms of the financial implications for an amalgam of quantifiable strategies and associated resourcing, including Community Safety Units, DCC4 and the two advisory groups, the estimated MPS Equalities budget for 2003/04 is £53, 799,307. This figure does not incorporate a number of other impactive strategies for example Safer Schools.
E. Background papers
(not attached but available via DCC4)
- Minimum standards for hate crime investigation
- Critical incident guide
- Operation Athena-Spectrum (menu of options)
- Racist/religiously aggravated offences police notice
- Police notice on faith hate incidents
- Guide to independent advisory groups
- Domestic violence strategy
- Police notices on third party reporting
F. Contact details
Report authors: Laura Parry, Performance Analyst, MPS Corporate Performance and Analysis Unit, Tanweer Chowdhury, Crime Analyst, Diversity Directorate DCC4(2) and Superintendent Dave Tucker.
For more information contact:
MPA general: 020 7202 0202
Media enquiries: 020 7202 0217/18
Send an e-mail linking to this page
Feedback