Contents
Report 5 of the 19 Sep 02 meeting of the Planning, Performance & Review Committee and discusses 999 call answering and response times to immediate incidents
Warning: This is archived material and may be out of date. The Metropolitan Police Authority has been replaced by the Mayor's Office for Policing and Crime (MOPC).
See the MOPC website for further information.
999 call answering and response to urgent incidents
Report: 5
Date: 19 September 2002
By: Commissioner
Summary
This report provides details of performance against targets in respect of 999 call answering and response times to immediate incidents, and examines areas to improve performance.
A. Recommendations - That
- Members note the report; and
- Members consider whether to retain the current time targets as part of the 2003/04 planning process (paragraph 29 refers).
B. Supporting information
Introduction
1. This report was first presented to the August meeting of the MPS Performance Review Committee. Whilst 999 call answering and response to immediate incidents have been considered in separate sections of this report, it should be acknowledged that performance in these areas can impact on each other. For example, increases in the time taken by police to respond to incidents may lead to a rise in the number of 999 calls, as additional calls are made to query when police will arrive. Likewise, the time taken to complete the CAD incident screen will impact on the time taken to respond to an incident.
999 call answering performance
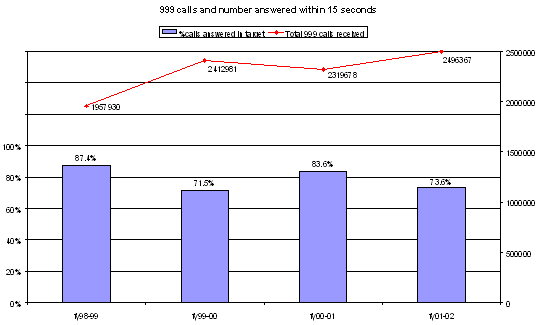
2. The target for 2002/03 is for 80% of 999 calls to be answered within 15 seconds. The following chart shows call volume, and performance against target, over recent planning years:
3. Performance over the first four months of the current planning year is 71.8%, a slight fall against the last planning year (73.6%), but an improvement over the comparative period last year, and similar to achievement over the same months in 1999/00 and 2000/2001, as shown in the following chart:
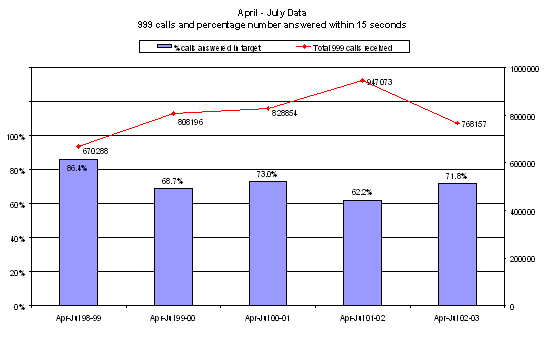
4. Note that poorest performance corresponds with the highest volume of calls. The number of calls in 2002/03 is lower than in previous years - and this could lead to an expectation of improved performance - it should however be noted that volume is not comparable between years. Due to the large increase in the number of silent mobile phone calls, an automatic call distribution for silent mobile calls (the automatic attendant) was introduced in mid-July 2001. This diverted silent mobile calls to a message, asking the caller to press ‘55’ if there was an emergency. This has had the effect of noticeably reducing the volume of calls to be answered.
5. The number of calls across the country transferred to the automatic attendant has continued to increase. In October 2001 the level was around 370,000 this has now increased to 643,000 in July 2002. (Of these calls, about 0.2% are then transferred to an emergency line.) The MPS share of the silent mobile calls has been estimated at 20 - 25% of the total (although MPS share of the silent mobile calls transferred back as an emergency is nearer 29%.) Using the lower estimate for the MPS, the following chart shows monthly variations in performance against target, and volume of calls, and the levels of calls that would have been reached had the automatic attendant not been introduced.
Seasonality
6. The 999 call volume is higher in summer months than in the winter, traditionally peaking between May to August each year. Since staffing levels are not seasonal, higher levels of performance tend to correspond with the winter months. This is borne out by performance last year, where over the second half of the year (Oct-01 to Mar-02) calls were answered within 15 seconds 83% of the time, compared with 66% of the time in the first half of the year.
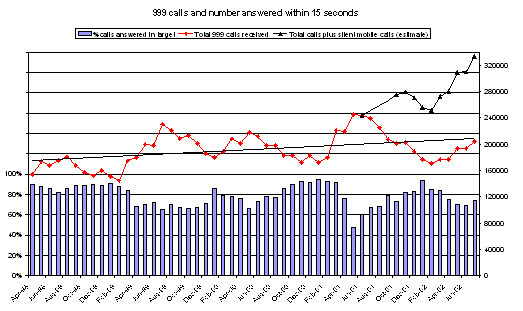
7. Since the introduction of the automatic attendant, calls have fallen back to the pattern seen over previous years, but still reflect a slight underlying upward trend in numbers. It should also be noted that the MPS deals with the overflow of emergency calls from both the London Fire Brigade and the London Ambulance Service call centres.
Factors influencing performance of Information Room (IR)
8. For various reasons, including recruitment and retention difficulties, IR shifts are continually under the planned strength. Since December 2001, shifts have averaged 5 communicators (14%) under the planned strength for the shifts. Training courses at IR for new recruits are held through the year. There are nine places on each course, which take six weeks to complete. Additionally, extra courses have been run at Hendon for nine new recruits at a time. The second Hendon course this year is planned for September. It is important to note that increased staffing will not immediately impact on performance, since following training new recruits are tutored in IR on a 1-1 or 1-2 basis for four weeks.
9. There are many causes of retention difficulties, which include:
- Shifts - difficulty in finding communicators able to cover night shifts eg due to transport difficulties (this could potentially be exacerbated by the congestion charge).
- Sickness issues including repetitive strain injury.
- Some external call handling jobs can attract higher pay.
- No incentive to progress through IR (those with greater experience are eligible to handle the more difficult calls - however there is no increase in pay for the greater responsibility).
Following previous discussions at the Planning, Performance and Review Committee, it is not however felt that budgetary constraint is a mayor issue affecting civil staff numbers.
Actions to improve performance
Use of overtime
10. Overtime has historically been used to cover both gaps in staffing levels and the seasonal increase in the volume of calls in the summer. Overtime tends now to be used just to cover the gaps in staff levels. More overtime is however available than is taken up. The practice of using officers from borough to work overtime in IR continues, but in recent months some boroughs have begun to cap the number of days overtime their officers are allowed to work centrally. IR are training more divisional staff to take on this role.
Improving supervision
11. IR have been putting systems in place to improve first line supervision including ensuring correct adherence to break schedules. They are also looking at ways to reduce the time communicators are in call work (ie not available to take calls - mainly due to completion of a CAD following a call). IR are also looking at the timing of break schedules during the day with possible plans to revise these to improve coverage.
Flexible rostering
12. IR are exploring the feasibility of introducing a flexible rostering system in order to better meet demand requirements, and to allow for account to be taken of individual requirements. Such a system would be resource intensive to put in place and IR are evaluating a Teleopti software package to deal with this. This demand management system would predict call volume based on historic data and suggest staffing levels. The cost of such a system would however be up to 170k.
Changing the system
13. IR are considering the impact of a number of options that change the routing of calls. These include routing calls directly to borough controls rooms if the queue of 999 calls is over 150 seconds, or alternatively if all communicators are busy. The impact of such changes on the corporate target would need to be assessed, since calls routed directly to borough would not automatically be counted towards the target. As mentioned previously, the MPS deals with the overflow of emergency calls from both the London Fire Brigade and the London Ambulance Service call centres - the MPS would be continuing discussions with both services with a view to bringing this agreement to an end.
Measurement of performance
14. The current target measures percentage of calls answered within 15 seconds - but does not capture improving or deteriorating performance in those calls which take over 15 seconds to answer. Historic data is not available to monitor this, however between mid-July to mid-August, the average time taken to answer the calls outside 15 seconds was 63.5 seconds. Just over one quarter of the calls not meeting the standard were answered within 30 seconds. If current time targets are to be retained (see paragraph 4), consideration could be given to a supplementary target that measures the average time taken to answer calls outside of the standard.
Future relocation of communication officers
15. In anticipation of the phased relocation of communication officers (due to commence end 2004) as part of the introduction of C3i, all communications officers both at IR and on borough have been written to asking for preferred choice of call centre. Only a small number (around 6 - 8%) have so far indicated that they do not wish to transfer - this is being built into the recruitment profile.
Response to urgent incidents - performance
16. Performance in April - July over recent years is shown below:
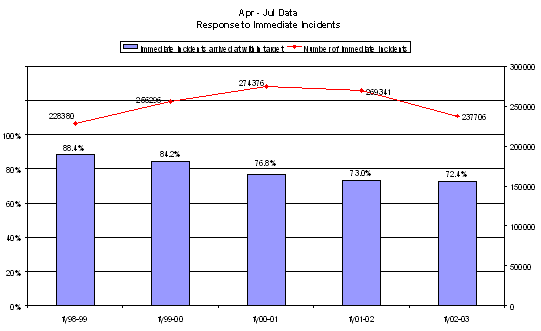
17. The number of calls responded to within 12 minutes, at 72.4%, is similar to the performance over 2001/02 as a whole (72.5%). A breakdown of performance by borough (in the form of a Boston Box) is attached at Appendix A.
Breakdown of time taken to respond to immediate incidents
18. Whilst the response target is 75% inside 12 minutes, it is interesting to see how the average time has changed, and how this breaks down (to show time taken to create the CAD, time taken to route the CAD, time taken to deploy a unit to the incident, and the time taken to arrive at the incident). In the first four months of the 2002/03 planning year, the average time taken between receipt of an urgent incident, and the arrival of an officer at the scene was 13.3 minutes (ie just above the standard of 12 minutes). This had increased marginally from 13.2 in the same period last year.
19. Whilst, however, the average time has increased slightly, this is more likely to be due to changes in the types of calls responded to rather than an actual increase in the time taken to respond. Average time taken to respond to urgent incidents received as 999 calls reduced slightly from 13.9 minutes to 13.8 minutes over the same periods, likewise time taken to respond to other urgent incident reduced from 12.1 to 12.0. Note that the time taken to arrive at other urgent incidents is shorter than for 999 calls. The time to create a CAD for these cases is about a minute shorter, a large proportion of these being alarm calls. The number of non-999 CADs has reduced noticeably between the two time periods - in 2001 33% of CADs were non-999, this figure is now 27%.
20. The breakdown of the time taken to respond to urgent incidents shows that just over half relates to the time from assignment of a unit to arrival at the scene. The time taken to assign a unit is just over a quarter of the total time.
21. The most noticeable change in the breakdown is in the time taken to assign a unit (having reduced from 4.0 to 3.7 minutes). There has however been a very slight increase in the time taken from assignment of a unit to the time of arrival. The time to create the CAD for emergency calls has stayed roughly stable at just over two minutes.
Comparison with other metropolitan forces
22. Targets and performance for all metropolitan forces have been compared. Two forces have not set targets for 2002/03. Of the seven forces, no force achieved their target set for 2001/02. The targets between forces do however vary in three ways:
- Forces begin their count at different times. Four forces (including the MPS) begin counting from the moment the incident screen is created, other forces begin counting from the time the incident screen is completed, or transferred to the local operator.
- The standard to respond within varies from 10 minutes to 15 minutes (MPS 12 minutes).
- The target percentage for achievement of the standard varies between 75% (MPS) and 95% (Northumbria)
23. It is of interest that the forces with the shorter 10 minute standard tend to be those which begin counting after the CAD has been created. In the MPS, the average time to create the incident report in cases of emergency calls is just over 2 minutes.
Urgent incidents outside 12 minutes
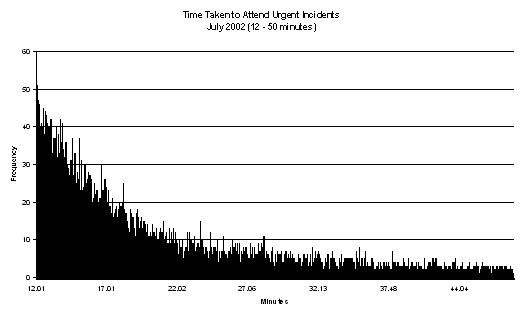
24. The chart below shows, for the month of July 2002, the frequency for response times that took over 12 minutes to arrive at (note times over 50 minutes are not shown). One third of incidents not meeting the standard were arrived at within three minutes of the standard. It is also of note though that a further third of incidents outside of time took over 23 minutes to arrive at, or did not have a time of arrival recorded.
25. For the period April to July 2002, 76% of urgent incidents in the MPS were arrived at within 13 minutes and 81% were arrived at within 15 minutes.
Telephone investigations
26. The Crime Management Best Value Review identified that crime related calls, with the exception of those designated as requiring an immediate response, could be reported and investigated over the telephone. The increased use of telephone investigation (TI) reduces the need to respond to "Soon" grade incidents and frees up the time of response teams. Two pilot boroughs, Southwark and Enfield have established TI to the standard recommended by the TP crime command.
27. Over the period April - July 2002, 23% of TNOs across the MPS were flagged as TI (22% in 2001/02). The corresponding figure for Southwark is 32.6% (32.5% in 2001/02) and for Enfield is 36.6% (29.1% in 2001/02). Both Southwark and Enfield have experienced reductions in the number of ‘Soon’ grade incidents between 2000/01 and 2001/02 (reductions of 18% and 8% respectively). The MPS however has also seen a 13% reduction in ‘Soon’ grade incidents over the same period.
28. The impact of TI on response times to urgent incidents at this stage appears to be inconclusive in terms of improved measurable performance levels. A comparison of response times to immediate incidents for Southwark and Enfield shows that the number within 12 minutes is 73.6% and 67.3% respectively over Apr-Jul 2002 (MPS 72.4%). Performance at Enfield has improved by around three percentage points compared with 2001/02 but is below the MPS average. Southwark performance is slightly above MPS average and has remained consistent between the years.
Other actions to improve response times
29. In November 2001, Camden Borough introduced a new instruction - under the title Operation Focus - aimed at improving response times. This followed an analysis of the types of calls where response times were lowest and included measures to deal with each type of call. Measures included: not assigning multiple units to single low risk calls; and in some cases re-contacting callers in order to provide a more focused, prioritised response. Measures similar to these are being considered as part of the business processes for C3i (the officer responsible for the analysis at Camden having since spent time attached to C3i.)
30. In the eight months following introduction of Operation Focus (Dec-01 to Jul-02), 71% of immediate incidents at Camden were responded to within the standard (MPS 73% over same period). This is an improvement over the corresponding months prior to the change in system (Dec-00 to Jul-01) where the percentage of incidents responded to within standard at Camden was 67%.
Future targets/actions
31. The 2002/03 Best Value Performance Indicators for the police service have moved away from indicators that measure the actual time taken to answer calls / respond to incidents and will now measure customer satisfaction with the time taken. In light of these changes, the MPS/MPA may wish to consider whether to retain the current time targets as part of the 2003/04 planning process.
32. The work on actions to increase coverage in IR is continuing. MPS policy regarding response to incidents will be influenced by, and need to take account of the Policing Model and the introduction of C3i. Additionally, the contents of this paper will be fed into the Best Value Review of Demand Management, which is due to report to the Demand Management Strategic Committee by the end of the year.
C. Equality and diversity implications
The contents and recommendations of this paper are not considered to have equality and diversity implications.
D. Financial implications
See paragraph 12 (flexible rostering system)
E. Background papers
None.
F. Contact details
Report author: Lesley Nichols, Corporate Performance Analysis Unit
For more information contact:
MPA general: 020 7202 0202
Media enquiries: 020 7202 0217/18
Supporting material
- Appendix A [PDF]
Response to urgent incidents - April-July 2002
Send an e-mail linking to this page
Feedback