Contents
Report 10 of the 19 January 2005 meeting of the Planning, Performance & Review Committee and provides a statistical overview of knife enabled crime in the Metropolitan Police District between April and October 2004.
Warning: This is archived material and may be out of date. The Metropolitan Police Authority has been replaced by the Mayor's Office for Policing and Crime (MOPC).
See the MOPC website for further information.
Knife enabled crime
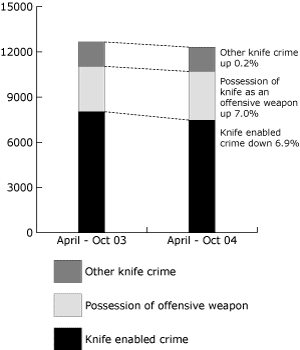
Report: 10
Date: 19 January 2005
By: Commissioner
Summary
This report provides a statistical overview of knife enabled crime in the Metropolitan Police District between April and October 2004. The main findings of the report show the following:
- Knife enabled crime is falling – down almost seven per cent April to October with a sustained decline since January 2004.
- Young males are most likely to be victims of knife enabled crime, with over half of all victims aged under twenty-five.
- Knives are used predominantly in violence against the person and robbery offences. 14% of all knife enabled crimes are recorded as domestic violence.
- Operation Blunt is the MPS response to dealing with knife enabled crime and aims to detect and deter young people from carrying knives. It is an interactive project, combining several approaches: police proactivity, education through schools engagement, effective use of media and marketing campaigns, judicial participation and establishing and collaborating with an Independent Advisory Group.
- It is too early to evaluate the effectiveness of Operation Blunt; too little data is available to make worthwhile comparisons.
- Further research and analysis can be provided. This will be directed by Operation Blunt and the Independent Advisory Group.
A. Recommendations
That the report be noted
B. Supporting information
Definitions
1. Knife enabled crime is defined as any offence within the categories violence against the person, sexual offence, robbery or burglary that has been recorded on the Metropolitan Police Service’s (MPS) crime recording system with a feature code that shows specifically that a knife was used during the commission of the offence. Offences of possession of an offensive weapon are excluded from the main analysis, as are offences where sharp instruments were used.
2. Knife enabled crime has been selected as the MPS measure of knife crime as it closely aligns with the PPAF (Policing Performance Assessment Framework) definition of gun enabled crime. This approach enables the MPS to monitor the impact of the use of weapons, particularly guns and knives, in a consistent way.
3. Unless otherwise stated, all time periods refer to the planning year to date (PYTD) - April to October 2004. Comparisons are made with April to October 2003.
Overview of all recorded offences where a knife was used
4. It should be remembered that knife enabled crime does not include all crime where knives are involved in the commission of an offence. Feature codes for knife usage can be equally applied to offences outside of the knife enabled crime definition i.e. theft and handling, fraud or forgery, criminal damage, drugs offences and other notifiable offences. Table 1 shows recorded volumes and percentage change in volume for all offences April to October 2003 and 2004 for the main Home Office crime categories, where a knife was used in the commission of the offence. It can be seen that offences of violence against the person (almost one third of all knife crimes), including possession of an offensive weapon (one quarter), and robbery predominate (a further quarter of all knife crime).
Table 1: All knife crime by crime category
| Category | April to October 2003 | April to October 2004 | Change | Percentage change |
|---|---|---|---|---|
| Violence against the person* | 3,551 | 3,697 | 146 | 4.1 |
| (Possession of offensive weapon – knife) | 3,015 | 3,225 | 210 | 7.0 |
| Sexual offences | 105 | 98 | -7 | -6.7 |
| Robbery | 3,930 | 3,333 | -597 | -15.2 |
| Burglary | 443 | 348 | -95 | -21.4 |
| Theft and handling | 451 | 448 | -3 | -0.7 |
| Criminal damage | 479 | 653 | 174 | 36.3 |
| Fraud or forgery | 19 | 8 | -11 | -57.9 |
| Drugs | 127 | 70 | -57 | -44.9 |
| Other notifiable offences | 541 | 441 | -100 | -18.5 |
| Total | 12,661 | 12,321 | -340 | -2.7 |
*Excluding possession of offensive weapon – knife.
5. Chart 1 below shows a comparison of knife enabled crime and other knife crime. For the purposes of this comparison, possession of offensive weapons where a knife was the weapon has been included. In April to October 2004 there were 12,321 offences recorded where a knife was used, a decrease of 2.7% (340 fewer offences).
6. Just under two-thirds of these offences were defined as knife enabled crimes; just under one eighth were other crimes where a knife was used and just over one quarter were knife possession offences. See chart 1 for representation of change in offence levels.
Chart 1: Knife crime overview April to October 2003 and 2004

Victim reported offences are down, police reported offences are up.
Overview of knife enabled crime data
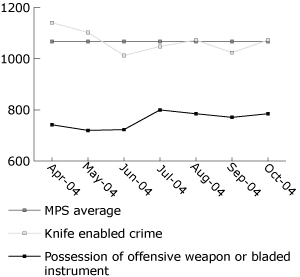
7. In the seven months April to October 2004 the MPS recorded 7,476 knife enabled crimes, an average of 1,068 per month. This represents a decrease of 6.9% on the same period last year, the equivalent of 554 fewer offences. Since January 2004 there has been a slight downward trend in knife enabled crimes, although this is not statistically significant. Chart 2 shows monthly knife enabled crime totals since April this year. Possession of knives as an offensive weapon are included to demonstrate that police initiated contact with those carrying knives is being sustained, whilst the incidence of victim initiated contact i.e. those reporting to the police as victims of knife crime is beginning to decline.
Chart 2: Knife enabled crime, April to October 2004

Trend is down slightly (not statistically significant).
8. 1,043, or 14% of all knife enabled crimes are recorded under the heading of domestic violence. The MPS recognises the impact of domestic violence on victims and communities and acknowledges that the problem-solving approach required when dealing with knife enabled domestic violence may vary considerably from that required in a non-domestic situation.
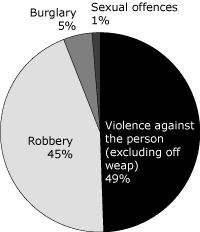
9. Chart 3 below shows the breakdown of knife enabled crime by main crime category. Violence against the person (VAP) and robbery offences predominate, with 3,697 and 3,333 offences respectively. There has been a small increase in the number of knife enabled VAP offences recorded (+4.1%, or 146 offences) and a larger decrease in knife enabled robberies (-15.2%, or almost 600 fewer offences). During this period, offences of possession of a knife as an offensive weapon (which does not form part of the knife enabled crime group of offences) have risen by 7.0%, up from 3,015 to 3,225, or 210 additional offences.
Chart 3: Knife enabled crime by main crime category – April to October 2004

Violence against the person and robbery predominate knife enabled crime
10. The decrease in knife enabled crimes (i.e. those reported by the public and recorded by the police as an actual crime incident), coupled with the increase in possession offences (i.e. those offences recorded by the police as a result of police-initiated activity such as stop and search) may be indicative of a more intelligence-led problem solving approach to dealing with such offences. A future evaluation of the effectiveness of Operation Blunt, the MPS’s knife crime initiative (see paragraph 22), may confirm this in time. Further research into the reasons why knives are carried, and why they are used, is planned for the future. Initial research commissioned by the MPS has examined violent crime in the wider context of weapon enabled crime and violence amongst different groups. Early findings are likely to be published in April.
11. The risk to victims of serious injury is four and a half times greater in offences of knife enabled crime than in the same offences (i.e. violence against the person, sexual offences, robbery and burglary) where knives were not recorded as being used. The risk of serious injury is more than twice as great for knife enabled crimes than for gun enabled crimes. Only one third of knife enabled crimes involve no injury.
12. In terms of volume contributors to knife enabled crime the boroughs with the highest level of recorded offences are Newham, Haringey, Brent, Tower Hamlets, Hackney, Lambeth and Southwark. Almost forty per cent of all knife enabled crime is recorded on these seven boroughs.
13. These seven boroughs form one axis of a matrix that also includes other priority crime types (these boroughs are also designated Operation Safer Streets boroughs, gun crime initiative and crack cocaine initiative boroughs). There may be opportunities for successful interventions in either borough, or crime type, that can be spread more widely than their current geographic or crime type boundaries permit.
14. Lambeth and Newham however show substantial decreases in offence levels, each recording ninety fewer offences. This represents 16.2% and 19.3% decreases respectively. The scatter chart at Appendix 1 shows knife enabled crime volumes and percentage change in knife enabled crime levels across the boroughs. It provides an indication of those boroughs that are volume contributors to offence totals, and also those boroughs that are undergoing reductions or increases in volume.
Disproportionality
15. Using self-defined ethnicity (16+1) shows that just under a fifth (19.1%) of all victims were ‘White British’. The next largest grouping were people of ‘any other white background’, who accounted for 4.4% of victims, followed by Caribbean people (3.9%).
16. The data shown under-record ethnicity, because more than half of victims’ self defined ethnicity was not recorded on the Crime Reporting Information System.
17. Seventy-two percent of all knife enabled crime victims are male. This proportion remains unchanged over the two periods.
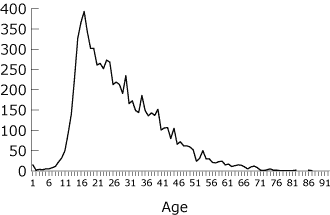
18. The peak age for being a victim of knife enabled crime is seventeen years old (see chart 4 below). Twenty per cent of victims are youths aged ten to seventeen. Half of all victims are aged twenty-five or under.
Chart 4: Knife enabled crime by victim age, April to October 2004

Half of all victims are aged twenty-five or under.
Knife enabled hate crime
19. Table 2 shows the volume and percentage change for hate crimes April to October 2003 and 2004. The proportion of knife enabled crimes that are also recorded as hate crimes is 16.2%.
Table 2: Knife enabled hate crimes
| Category | April to October 2003 | April to October 2004 | Change | Percentage change |
|---|---|---|---|---|
| Racist crime | 164 | 153 | -11 | -6.7 |
| Domestic violence | 971 | 1043 | +72 | +7.4 |
| Homophobic crime | 17 | 12 | -5 | -29.4 |
| Total | 1,152 | 1208 | +56 | +4.9 |
Note that due to the numbers involved, small changes in volume can lead to large percentage changes.
20. The risk of injury from a knife enabled hate crime is greater than crime generally and also greater than the risk of knife enabled crime. The risk is highest for domestic violence and this risk would appear to be rising.
MPS activity
21. Operation Blunt is the MPS response to detect and deter young people from carrying knives on the streets of London. This is consistent with the MPS Vision of ‘Making London the safest major city in the world’. Commander Simon Foy, assisted by Detective Chief Inspector Gary Baldock, strategically leads the initiative. The activity highlighted below is being collated into a BOCU tactical options guide, which will be made available to all London OCUs and will inform the development of a Corporate Control Strategy for Knife Enabled Crime.
22. Operation Blunt has six strands:
- Proactive operations
- Schools engagement programmes
- Establishing pilot sites across the MPS
- Setting up an Independent Advisory Group to support the pilot sites
- Media and marketing campaign
- Judicial participation regarding sentencing policies.
23. A number of proactive operations have been planned over the coming months, commencing early December at Hammersmith central transport hub. This operation will trial a new piece of equipment, called ferro-guard, to detect people potentially carrying knives, and will involve officers from the MPS Transport OCU, British Transport Police and from Hammersmith BOCU.
24. Activity is under way to establish the schools engagement programme, with three pilot areas – Hackney, Harrow and Southwark – selected. The detail of this programme is yet to be agreed, but meetings to discuss available options have been planned.
25. Seven pilot sites have been set up across London to with the aim of developing knife crime reduction initiatives in their particular areas. These are; Southwark and Haringey, which are more advanced in progressing the initiative, Sutton, Hammersmith, Hackney, Transport OCU and Clubs and Vice OCU.
26. Initial activity generated by the Southwark experience includes:
- The establishment of a tactical group to monitor and co-ordinate activity
- The positioning of knife amnesty bins in appropriate locations
- A poster campaign - a competition to be held in schools to design a poster.
27. Whilst it is too early to assess the effectiveness of Operation Blunt in reducing the incidence of knife crime, it is acknowledged that the impact this activity has on the routine carrying of knives will be harder to assess.
28. A review of data collection for knife enabled crime revealed there continue to be inconsistencies in recording practices across the 32 boroughs. A themed performance review of knife crime has highlighted areas for improvement, which will lead to better data quality and deliver enhanced analysis.
29. Efforts continue to improve the quality of MPS corporate data. Of particular relevance is the work undertaken under the National Crime Recording Standard (NCRS), and an update paper highlighting recent improvements will be presented separately to January’s PPRC.
30. Whilst the MPS recognises the importance of accurate data recording it should be noted that even at the higher estimate, knife enabled crime remains a relatively infrequent event. During the period in question and based on this higher estimate, knife enabled crime comprised less than two per cent of all recorded crime.
C. Race and equality impact
The differential impact of knife enabled crime on victims is discussed above.
D. Financial implications
Initial development of initiatives at the seven pilot sites is being borne out of current resources. It is likely however, that funding streams will need to be explored to develop potential initiatives that arise out of the pilot work.
E. Background papers
None
F. Contact details
Report authors: Graeme Keeling, Senior Performance Analyst, Corporate Performance Group
For more information contact:
MPA general: 020 7202 0202
Media enquiries: 020 7202 0217/18
Supporting material
- Appendix 1 [PDF]
Knife enabled crime volumes, MPS boroughs April to Oct 2004
Send an e-mail linking to this page
Feedback