Contents
Report 4 of the 13 Mar 01 meeting of the Professional Standards and Performance Monitoring Committee and is the second of the quarterly reports on burglary.
Warning: This is archived material and may be out of date. The Metropolitan Police Authority has been replaced by the Mayor's Office for Policing and Crime (MOPC).
See the MOPC website for further information.
MPS performance against burglary
Report: 4
Date: 13 March 2001
By: Commissioner
Summary
This is the second of the quarterly reports on burglary and reviews recent performance against targets, and the progress of current initiatives to reduce volume crime, specifically burglary.
A. Recommendation
Members are asked to note the report.
B. Supporting information
Introduction
1. This paper follows the overview report provided to PSPM at the December meeting and provides an update on performance since October 2000. The paper follows through on some specific issues raised in the last report including current initiatives in MPS policy and practice and use of DNA identification in burglary investigation.
Performance against burglary (April 2000 – January 2001)
Crime reduction
2000/2001 target - to reduce burglary by 2 per cent
2. The crime reduction target is being comfortably achieved, with the level of reduction over the ten months of the
planning year to date being 9.8 per cent in comparison with the same months in 1999/2000. The levels of reduction for both residential and non-residential burglary are very similar, at 9.7 per cent
and 10.0 per cent respectively over the same comparison period.
3. Burglary artifice (i.e. where artifice has been used to gain access to a premises in order to commit burglary) takes up around 4 per cent of all burglary offences and can be either residential or non-residential. Burglary artifice again displays a similar reduction trend and has reduced by 10.0 per cent over the period April to December 2000, compared with the same period in 1999.
4. Appendix 1 show the monthly breakdown of residential and non-residential burglary offences, together with detection rates.
5. The monthly levels of offences since the last report (to October 2000) shows that there have been some increases in residential burglary (the daily rate of offences for the three months November 2000 to January 2001 being 208, compared with the daily rate over the rolling year of 194). This, however, follows an established seasonal trend which had been referred to in the previous report (paragraph 12 referred to the increase in residential burglary offences between November 1999 and January 2000). Since this trend is apparent in both years, there has not been a deterioration in year to date performance, rather, a slight improvement from a 9.1 per cent reduction (Apr to Oct) to 9.7 per cent (Apr to Jan).
6. The level of offences for non-residential burglary does not follow the same seasonal trend (the daily rate of offences for the three months November 2000 to January 2001 was 111, compared with the daily rate over the rolling year of 117.)
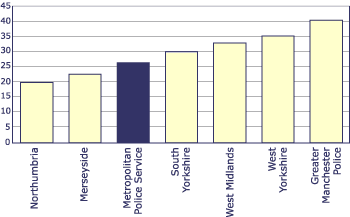
7. The following metropolitan forces comparison shows residential burglary per 1000 households for the year ending September 2000. Figures have been taken from the Home Office Statistical Bulletin 1/01, published in January and show that the there is a lower level of residential burglary in the MPS than in four of the six other metropolitan forces:
Metropolitan forces comparison - residential burglary for the 12 months ending September 2000 shown per 1000 households

Judicial disposals
2000/2001 target – to achieve a JD rate of 10 per cent
8. The JD rate for the ten months of the year to date is 9.97 per cent. This is the first occasion that
the JD rate (for the year to date) has fallen below target since May 2001. There was a noticeable drop in performance in January when the rate fell to 7.3 per cent. Appendix 1 show the individual
monthly rates broken down into residential and non-residential burglary and show that the greater fall is within the JD rate for residential burglary.
9. Further analysis of burglary JD rates has identified a fall within the number of JDS relating to cases taken into consideration (TIC) at the courts where the crime had been previously recorded. The JD rate for the year to date comprises 3.47 per cent relating to TICs previously recorded, and 6.50 per cent relating to all other kinds of JD (i.e. charge/summons and caution). In January, the percentages were 1.79 per cent and 5.56 per cent respectively. The drop off in TICs previously recorded identifies the need to establish better identification links for crime series. This work is ongoing as part of the Scientific Support Strategy, and the Forensic Investigation Unit is to be established in the next corporate planning year to address the issue of making better use of TICs previously recorded.
10. Boroughs have been made aware of the recent fall in JD rates and have been asked to ensure that any outstanding DNA and fingerprint identifications that could result in a judicial disposals are followed through. A number of the proactive teams that had previously dealt with this have recently been engaged in Operation Crackdown, but have now returned to this area of investigation.
Repeat victimisation
11. The recently published Audit Commission report for 1999/2000 provided a national comparison of repeat victimisation relating to residential burglary. This showed that the percentage of domestic burglaries where the property had been burgled in the previous 12 months averaged 8.6 per cent across all forces in England and Wales. The comparative figure for the MPS was 8.0 per cent (it should however be noted that there is likely to be differences between the way individual forces compile these statistics). Further analysis of repeat burglaries across the MPS showed that boroughs with high burglary rates were also likely to have high repeat rates.
Types of premises burgled
12. A brief analysis of the location codes used to identify the types of properties burgled, shows that most codes have reduced in line with the general burglary reduction. For example, use of the location codes for house/bungalow has reduced by around 13 per cent compared with last year (April to January comparison), and use of the code for flat/maisonette has reduced by around 10 per cent.
13. Out of the more commonly used codes, only two show an increase in usage in 2000/2001. The location code for offices has shown around a 7 per cent increase over the same comparison period and the code for privately owned premises has shown around an 18 per cent increase. It should however be noted that one or more location codes can be entered on each individual crime record, and an increase in the use of a certain code may reflect a change in the detail of recording, rather than an increase in burglary of specific premises. A burglary, for example, of a detached house could have a combination of location type codes for house/bungalow, detached premises, and privately owned premises entered on the crime record. (Privately owned premises is one of the more recent codes and was introduced in March 1998).
Current initiatives influencing MPS policy and practice
14. A number of initiatives to address burglary and other volume crimes are being developed both within the MPS and externally. As part of the Government's Crime Reduction Strategy the Home Office are in the process of developing Crime Reduction Toolkits (these were referred to briefly in the previous report on burglary). The toolkits are web-based packages that provide information on partnerships, good practice, tackling local problems and funding sources. The aim is that 22 toolkits will be developed which cover a range of crime types or aspects of criminality, including domestic burglary and repeat victimisation. At present four toolkits have been published (vehicle crime, street crime and robbery, anti-social behaviour, and rural crime) and can be accessed via the Home Office crime reduction website.
15. The MPS Operational Solutions Database can now be accessed by all MPS staff via the MPS intranet. The database site is a knowledge sharing initiative, which aims to see officers sharing best practice in dealing with robbery, burglary, drugs and vehicle crime across the MPS. The site contains examples of actual operations, tactics used, analysis carried out, and contact details for the officer in the case.
16. Also published on the MPS intranet is the Crime Policy Manual. The manual provides a reference for all crime policy, both generic and more specific. At present, it includes coverage of subjects such as Harassment, DNA and Home Office counting rules. It also provides a link to other policy documents, including MPS notices relating crime policy. The content of the manual is being developed over the next year.
Scientific support strategy for the MPS
17. This document sets out the MPS strategy for the development and use of scientific support services to detect and reduce crime and was published as an MPS Special Notice on 23 February 2001.
18. The strategy comprises the following eight key objectives:
- timely response to scenes
- timely results from forensic science/fingerprint support services
- maximising intelligence
- effective and efficient resource management
- training and development of personnel
- effective relationships with suppliers
- research and development to improve performance; and
- reviewing performance and measurement to identify best practice
19. As part of the Scientific Support Strategy and in order to meet Home Office requirements for all forces to produce comparable statistics relating to the use of forensic investigation and its contribution to crime detection rates, new systems for the recording of forensic submissions and results are to be introduced from 1 April 2001. The introduction of this system should allow for a clearer link between forensic identifications and detections.
DNA identifications for burglary
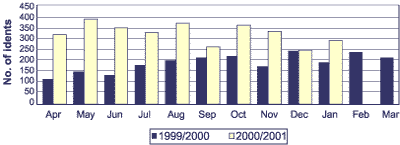
20. The number of DNA identifications for boroughs over the ten months of the planning year (April 2000 to January 2001) shows a 70 per cent increase over identifications during the same months in 1999/2000. Over half of the identifications in both years relate to burglary offences. The following chart shows the monthly increase in identifications specifically relating to burglary and reflects a 78 per cent increase in burglary identifications over the same comparison period:
Burglary DNA identifications

21. Whilst there has been a considerable increase in the number of identification over the two years, it is difficult at this stage to show the specific effect this has had on the detection rate (for example, a proportion of identifications will, following further investigation, be eliminated by the borough). Systems to be put into place from 1 April (see paragraph 19) will allow for a clearer link between identifications and detections.
Fingerprints identifications for burglary
22. The level of fingerprint identifications in 2000/2001 for all types of crime is running at about 2 per cent lower than the same months in 1999/2000. Following the introduction of the National Automated Fingerprint Identification System (NAFIS), old unmatched fingerprints were revisited in 1999/2000. This resulted in a higher number of identifications in that year. Whilst there were a high number of historic matches in 1999/2000, identifications in 2000/2001 are predominantly from current crimes. It should also be noted that the reduction in identifications in 2000/2001 is considerably smaller than the reduction in burglary offences. Thus, the level of identifications per crime scene is now running at a higher level than in 1999/2000.
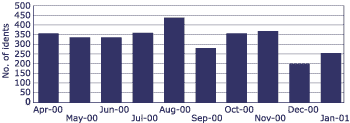
Burglary fingerprint identifications

23. Around a half of all fingerprint identifications for boroughs relate specifically to burglary. The monthly level of burglary identifications is shown in the following chart:
C. Financial implications
None
D. Background papers
- Home Office Statistical Bulletin 1/01
- Audit Commission Police and Fire Services Compendium 1999/2000
E. Contact details
This author of the report is Lesley Nichols, Corporate Performance Analysis Unit, MPS.
For information contact:
MPA general: 020 7202 0202
Media enquiries: 020 7202 0217/18
Supporting material
- Appendix 1 [PDF]
Performance Results - Volume Crime Analysis
Send an e-mail linking to this page
Feedback