Contents
Report 4 of the 11 March 2010 meeting of the Communities, Equalities and People Committee, with details of recruitment targets within the MPS for five years from April 2010.
Warning: This is archived material and may be out of date. The Metropolitan Police Authority has been replaced by the Mayor's Office for Policing and Crime (MOPC).
See the MOPC website for further information.
Recruitment targets
Report: 4
Date: 11 March 2010
By: Director of Human Resources on behalf of the Commissioner
Summary
This report provides prospective details of recruitment targets within the Metropolitan Police Service for five years from April 2010. The report provides targets for black and minority ethnic (BME) communities and gender for key MPS workforce groups, including police officers and special constables. The report outlines the mapping of self-declared workforce ethnic identity with local populations found across London boroughs. Anticipated outcomes for 2009/10 have been included. The report provides the foundation for further consultation within the MPS and with the MPA regarding the diversity and equalities agenda.
Executive summary
- The MPS has reached the highest levels of BME and female representation in its history at over 9.1% (n = 3,042) BME and 23.2% (n = 7,665) female officers. The BME officer strength has increased from 890 in March 1999 to an estimated 3,100 in March 2010, representing 9.3% of the officer workforce.
- BME representation amongst police recruits will reach over 17%, the second highest level in the last 10 years
- The HR community engagement programme has resulted in the appointment of the first 3 Somali police officers in the MPS
- 15.5% of police officers with 5 years of less service (around one quarter of police) are from BME communities, compared to 10.2% (6-10 years) and 5.0% (greater than 10 years)
- 35.7% of police officers with 5 years or less service are female, compared to 23.1% (6-10 years) and 15.9% (greater than 10 years)
- ethnic identity amongst constables within the Metropolitan Police Special Constabulary and Police Community Support Officers is comparable to the London population
- local targets (i.e. borough-by-borough) would mean deployment and postings decisions would be based upon ethnic/racial information, possibly contravening existing anti-discrimination and data-protection legislation
A. Recommendation
1. Members confirm the following key targets for 2010/11:
- 700 Police recruits (20.0% BME, 35.0% female) resulting in a strength of 33,129 (9.6% BME, 23.8% female)
- 681 Police Community Support Officers (25.4% BME, 35.7% female) resulting in strength of 4,716 (28.3% BME, 34.3% female)
- 2,488 Special constables (31.5% BME, 35.0% female) resulting in strength of 5,330 (31.3% BME, 31.8% female)
B. Supporting information
Forecast outcomes
2. The year-end forecast for BME police recruits is likely to exceed 280 officers, accounting for 17.2% of recruits (the second highest rate during the last ten years). Equally, the number of female recruits is likely to increase to around 37%. Table 1 presents the projected BME and female representation levels for key roles by the year-end.
Table 1 Projected BME and female representation by role at March 2010
| Role | BME | Female | Total | ||
|---|---|---|---|---|---|
| N | Percent | N | Percent | ||
| Police Officers | 3,096 | 9.3% | 7,758 | 23.3% | 33,230 |
| PCSO | 1,353 | 28.9% | 1,691 | 36.1% | 4,685 |
| Specials | 1,035 | 30.9% | 1,021 | 30.5% | 3,347 |
| Police Staff | 3,278 | 23.0% | 8,229 | 57.8% | 14,232 |
| Source: MPS Workforce Information, 2010 | |||||
3. Table 1 shows that the overall number of BME officers continues to grow. The expected year-end strength for BME police officers is very likely to reach nearly 3,100 officers or 9.3% strength, compared to 2,864 (8.8%) BME officers last year. The number of female police officers also continues to increase and is likely to reach 7,758 officers or 23.3% strength, compared to 7,296 (22.4%) female officers last year.
4. BME diversity amongst the extended policing family remains very good, with BME representation amongst PCSOs and special constables higher than the economically active BME population in London. The year-end BME strength for PCSOs and specials is likely to be around 1,353 (28.9%) PCSOs and 1,035 (30.9%) specials. The forecast year-end female strength for these two roles is likely to remain high at 1,691 (36.1%) PCSOs and 1,021 (30.5%) specials.
5. Significantly, the HR Community Engagement programme has directly resulted in the appointment of the first 3 Somali police officers. The programme has also resulted in around 650 applications from people from key priority communities, including Bangladeshi, Pakistani and Turkish-Kurdish communities, along with the introduction of new positive action support developed in partnership with several London colleges. The programme now includes local black communities.
MPS workforce
6. According to statistics developed by the Office of National Statistics (ONS), BME groups account for 31.5% of the London working-age population (i.e. females 16-59 years, males 16-64 years) in 2007. The White population accounted for 68.5% of the working population, whilst the Asian community and Black communities accounted for 14.1% and 10.5% respectively.
7. Overall BME representation within the MPS reached 15.7% by December 2009. BME representation levels differed by role. Good levels of representation were evident within the PCSO (29.5%) and special constabulary (32.0%) roles. BME representation amongst police staff was slightly below the working age population at 23.3%, whilst the level of BME representation amongst police officers continues to increase (9.1%). The number of BME police officers has increased substantially during the last 10 years from 890 officers in March 1999 to an anticipated 3,100 officers in March 2010, constituting a 250% increase in numbers.
8. Table 2 provides a summary of ethnic identity representation by role, along with ONS estimates for working age populations in London.
Table 2 ethnic identity representation by role summary
| Ethnic identity | Role | MPS | London | ||||
|---|---|---|---|---|---|---|---|
| Police | Specials | PCSO | Police staff | Traffic wardens | |||
| Mixed | 1.9% | 3.0% | 4.0% | 1.6% | 2.0% | 2.0% | 2.8% |
| Asian | 3.3% | 16.3% | 10.7% | 7.6% | 4.5% | 5.7% | 14.1% |
| Black | 2.6% | 7.9% | 10.3% | 11.8% | 12.9% | 5.9% | 10.5% |
| Chinese & others | 1.4% | 4.8% | 4.5% | 2.4% | 2.9% | 2.1% | 4.2% |
| BME sub total | 9.1% | 32.0% | 29.5% | 23.3% | 22.3% | 15.7% | 31.5% |
| White | 90.6% | 63.9% | 69.4% | 72.4% | 76.2% | 82.7% | 68.5% |
| Source: MPS Workforce Information (2010); Office of National Statistics (2010) | |||||||
9. Table 2 reveals the following achievements:
- Asian communities ranged between 3.3% (Police) and 16.3% (Specials), compared to a population of 14.1%. Indian and Pakistani communities were equivalent to London populations within the Special Constabulary
- Black communities ranged between 2.6% (Police) and 12.9% (Traffic Wardens), compared to a population of 10.5%. Black British community had a good representation by comparison to London estimates for all staff groups
- Mixed communities ranged between 1.6% (Staff) and 4.0% (PCSO), compared to a population of 2.8%. Mixed Black Caribbean White and Mixed Asian White communities were broadly equivalent to London populations within the Regular Constabulary
- Chinese and other communities ranged between 1.4% (Police) and 4.8% (Specials), compared to a population of 4.2%
10. Appendices 1A, 1B, 2A and 2B provide further details.
Length of service and BME representation amongst police officers
11. Whilst overall strength figures are informative, taking into account length of service (LOS), helps to provide an indication of visibility on the streets. Within the MPS at December 2009 there were 8,982 (27.0%) police officers with 5 years or less LOS, 8,126 (24.4%) police officers with 6 – 10 years LOS and 16,214 (48.7%) with more than 10 years LOS. Over one quarter of police officers have 5 years or less LOS, and account for approximately 40% of the officers providing local policing services.
12. Figure1 highlights BME representation amongst police officers having taken into account length of service.
Figure 1: BME representation amongst police officers by length of service (December 2009)
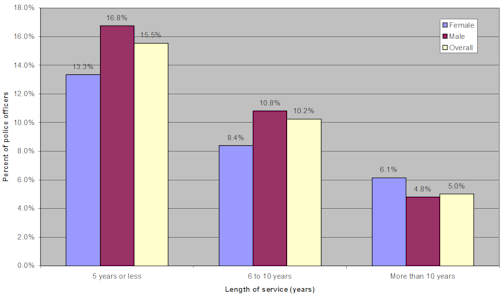
13. Figure 1 reveals that for police officers with 5 years or less LOS, the overall BME representation is around 15.5%, compared to 10.2% (6-10 years LOS) and 5.0% (more than 10 years LOS). The overall BME representation for police is 9.1%. Figure 1 also highlights the significant impact of recruitment strategies to improve BME diversity. Around 2,217 BME officers work within London boroughs, accounting for 10.8% of police officers within Territorial Policing.
14. Figure 2 presents the representation levels of each broad ethnic identity category by length of service.
Figure 2: Broad ethnic group representation amongst police by length of service (December 2009)
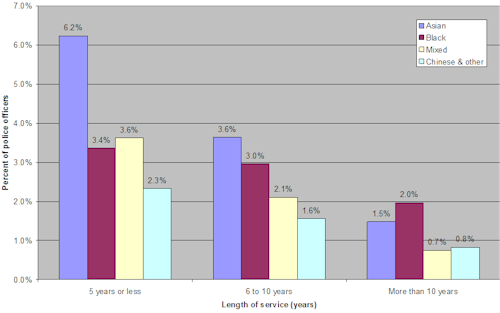
15. Figure 2 reveals that whilst there have been increases in all BME communities, the Asian community has increased at a greater rate and accounts for 6.2% of police with less than 5 years service. The Black community appears to have increased at a more modest rate and accounts for 3.4% of police with less than 5 years LOS. To some extent this finding is consistent with the operational requirement where community engagement focused upon the Bangladeshi and Pakistani communities, along with Somali and Turkish-Kurdish groups.
Gender
16. Table 3 provides a summary of female representation by broad ethnic identity groups and MPS roles, by comparison to the London population.
Table 3: female representation by broad ethnic groups and roles
| Ethnic group | Police | Staff | MSC | PCSO | London |
|---|---|---|---|---|---|
| Mixed | 2.4% | 1.9% | 3.3% | 4.2% | 2.9% |
| Asian | 2.7% | 7.7% | 12.5% | 4.8% | 13.9% |
| Black | 3.2% | 14.8% | 8.6% | 8.9% | 11.4% |
| Chinese and others | 1.4% | 2.6% | 4.6% | 3.5% | 4.3% |
| BME sub total | 9.7% | 27.0% | 29.0% | 21.4% | 32.5% |
| White | 90.0% | 69.3% | 67.1% | 76.8% | 67.5% |
| Overall | 23.0% | 58.1% | 30.2% | 34.4% | 48.3% |
| Source: MPS Workforce Information (2010); Office of National Statistics (2010) | |||||
17. Within the working age London population, females accounted for 48.3% of the population. Within the MPS, the female representation within the MPS varied according to role, with very high representation amongst police staff (58.1%), followed by PCSO (34.4%) and MSC (30.2%). Police officers comprise 23% female, though during the last 10 years this has increased from a starting point of 15%. Female representation amongst police officers varies by length of service, with higher levels associated with lower length of service. Within the 5 years or less group, female officers account for 35.7% compared to 23.1% (6-10 years LOS) and 15.9% (more than 10 years LOS).
18. The MSC role has been good at attracting BME females, particularly Indian (7.5%) and Pakistani (2.4%) females, whose representation levels are equal to the London population. The police staff roles have been attractive to females from the Black communities, particularly the Black Caribbean community (5.2%), which was equal to London’s population.
19. Female representation within the mixed ethnic identity group exceeded the London population within the PCSO (4.2%) and MSC (3.3%) roles, and slightly lower with the police group (2.4%). The police staff role (1.9%) had the lowest representation level of the mixed group within the different roles.
20. Appendices 2A and 2B provide further details.
Medium-term strategy
21. The HR community engagement programme has focused upon specific communities identified through the operational requirement as being priority groups. Consequently, whilst acknowledging the broader BME agenda, the community engagement programme has concentrated upon the Bangladeshi, Pakistani, Somali and Turkish-Kurdish communities. Preliminary work with representatives from these groups highlighted the need to address historical issues relating to community relations, particularly amongst younger people, as well as social-class based perceptions of policing as a career choice amongst older members with the power to influence choice. Therefore, PCSOs and special constabulary have become ways for people from many under-represented groups to assess the MPS as an employer before taking the next step to become regular constables.
22. The current deployment plan reflects the budgetary constraints with relatively little regular police recruitment for the foreseeable future, if current attrition levels continue. However, during the next few years, there will be acceleration in the number of special constables in the run-up to the Olympics 2012. Nevertheless, the low level of regular police recruitment coupled with very low turnover means that the opportunity to rapidly improve BME levels are constrained.
23. In order to help address this issue a medium-term strategy has been created to implement a recruitment campaign for special constables utilising organisational learning from the HR community engagement programme. Under the new campaign, safer neighbourhood teams (SNT) will encourage people from local communities to become special constables. The HR community engagement team will provide practical advice and guidance to local SNTs around specialist support and other forms of positive action. The central HR team will undertake an ongoing borough-by-borough comparative evaluation of performance.
24. Consequently, it is anticipated that the special constabulary will become the main route of entry into the regular constabulary, subject to further analysis. Safer neighbourhood teams will play a central role in sustaining the increase in the diversity of the MPS workforce, and ensuring that the special constabulary has a diverse pool of talent readily available for recruitment.
Overall recruitment targets
25. Table 4 provides details of overall recruitment targets for key roles during the next five years. Targets for the next 3 years are derived from the Deployment Plan, whilst targets for the final 2 years are based on an assumption of replacing leavers and no growth (see Appendix 4 for a summary of strength targets). The Deployment Plan is prepared in consultation with business groups and reflects the staffing requirement to meet anticipated demand within budgetary constraints.
Table 4: Provisional recruitment targets for next five financial years
| Role | 2010/11 | 2011/12 | 2012/13 | 2013/14 | 2014/15 |
|---|---|---|---|---|---|
| Police recruits | 700 | 670 | 610 | 726 | 726 |
| Police transfers | 300 | 300 | 300 | 300 | 300 |
| PCSO | 681 | 702 | 702 | 702 | 702 |
| Specials | 2,488 | 1,922 | 600 | 600 | 600 |
| Police staff | 1,589 | 1,330 | 969 | 947 | 947 |
| Source: MPS Workforce Information (2010) | |||||
26. Table 4 shows that around 30% of police recruited will be experienced officers, and 70% new recruits. There is an expectation that PCSOs will continue to play an important role as a career pathway. This strategy provides PCSOs with an additional progression opportunity, which is particularly valuable for under-represented groups who consider the PCSO role as a way of gaining an insight into the MPS before applying to become police officers.
27. The number of special constables reflects the sustained level of activity needed to increase the number of specials to meet the demands during the 2012 Olympics. Recruitment targets for specials will increase strength to 6,667 special constables by 2012. The Special Constabulary will also become an increasingly important career pathway into the MPS.
Female and Black and Minority Ethnic Strength and Recruitment Targets
28. Table 5 presents provisional BME and female recruitment and strength representation targets for 2010-11 (see Appendix 3 for provisional targets for 2011/12 and beyond).
Table 5: projected recruitment and strength representation for 2010/11
| Role | BME | Female | ||
|---|---|---|---|---|
| Recruits | Strength | Recruits | Strength | |
| Police recruits | 19.6% | 9.6% | 35.0% | 23.8% |
| Police transfers | 6.00% | 15.00% | ||
| PCSO | 25.4% | 28.3% | 35.7% | 34.3% |
| Specials | 31.5% | 31.3% | 35.0% | 31.8% |
| Police staff | 30.0% | 23.9% | 45.0% | 56.7% |
| Source: MPS Workforce Information (2010) | ||||
29. Table 5 reveals that overall BME representation amongst police officers is likely to reach 9.6% by April 2011, provided BME account for around 20% of recruits and over 6% of transfers from other forces. Female representation is likely to increase to just under 24%, provided females account for 35% of new recruits and around 15% transfers.
30. BME diversity within the special constabulary is likely to remain high with recruitment similar to the economically active population whilst female representation should increase to nearly 32%, with recruitment at 35%.
31. BME diversity amongst PCSO is likely to reach just over 28%, BME accounting for over a quarter of recruits. Female representation is likely to be around 34%, with recruitment at just under 36%.
32. BME representation amongst police staff is likely to increase to around 24%, provided BME account for 30% of new staff. Female representation will remain greater than the economically active population.
33. Appendix 3 provides further details of BME and female recruitment and strength projections for the next five years.
Issues around local target setting
34. The definition ‘local targets’ has been interpreted to mean geographically-based targets. In the case of the MPS, this could mean a target based upon the population of London or one based upon populations within each borough. In the case of the latter, the establishment of local targets could result in several issues, including:
- Where targets are based upon borough populations, the deployment or posting decision would need to be based upon ethnic or racial identity. Currently this activity could be challenged on the basis that it would amount to positive discrimination, particularly as many BME officers will be confined to working in areas with high levels of social deprivation. The outcomes could be seen to reinforce existing inequalities
- Ethnicity and other diversity information are provided on a voluntary basis for the purpose of “equality monitoring”. Consequently, where the information is being used for deployment or posting decisions then the information is being used for a purpose significantly different from that by which it was collected. This may lead to a legal challenge on the basis of data protection
- There is an issue of power and freedom of choice. Currently new police officers can choose where they wish to work provided there are vacancies at those locations. Conversely, where local targets are to be used, the choice of location will be dependent upon ethnicity, as well as other forms of identity, restricting personal freedom and choice
- Deployment decisions could not be limited solely to new recruits, but would also need to include the established workforce. The feasibility of implementing such a programme would need to be considered
- Deployment decisions based mainly on diversity information would constrain operational and experience postings
- Due to potential inequalities that may arise from applying a policy of local targets, there needs to be sound business justification. In the context of policing there would need to be, amongst other things, empirical evidence of a strong relationship between effective policing and parity with the local workforce and population
There is a requirement to carry out further work before we pursue this further.
C. Race and equality impact
The equalities implications have been discussed within the body of the report.
D. Financial implications
The costs associated with the monitoring, and associated recruitment strategies, set out in the report above are covered in existing HR budgets as set out in the 2010/13 Business Plan. The costs associated with staff levels within the organisation are covered by business wide budgets as set within the 2010/13 Business Plan.
E. Legal implications
1. As a public authority the MPA is under an active duty to take remedial steps to reduce inequalities. As part of this duty the MPA regularly sets recruitment targets for the MPS. Currently targets are only set for BME and female staff and officers where there must be evidence of under representation, in the past 12 months, in persons doing that work at the work place or compared to the local population.
2. The CRE Code of Guidance gives as examples of encouragement the wording of job advertisements and information about careers and vacancies provided to areas with large ethnic minority populations. The report identifies where this has been effective in attracting applications from key priority communities.
3. This is a limited right to take positive action in respect of providing access to work related training and encouraging persons to take advantage of opportunities for doing that work and the MPS recognises that the provision of aspirational targets does not allow for the maintenance of quotas regardless of a candidate’s merits.
4. The issues around local target setting have been highlighted and specific legal advice should be provided once it is known how such targets might operate.
F. Background papers
None
G. Contact details
Report authors:
- Majella Myers, Director of Recruitment and Workforce Planning
- George Clarke, Chief Superintendent
- Duncan Arnold MSc, LLB (Hons), Senior Policy Researcher
For information contact:
MPA general: 020 7202 0202
Media enquiries: 020 7202 0217/18
Appendix 1A
Ethnic identity within MPS roles (end-December 2009)
| Ethnic identity | Role | MPS | London working age population (June 07) | ||||
|---|---|---|---|---|---|---|---|
| Police | Specials | PCSO | Police staff | Traffic wardens | |||
| White: British | 87.3% | 54.3% | 63.0% | 68.6% | 70.9% | 78.7% | 55.9% |
| White: Irish | 1.5% | 2.2% | 1.5% | 1.4% | 3.7% | 1.5% | 2.2% |
| White: Other White | 1.9% | 7.5% | 4.9% | 2.4% | 1.5% | 2.5% | 10.4% |
| Mixed: White and Black Caribbean | 0.5% | 0.3% | 1.3% | 0.5% | 0.8% | 0.5% | 0.7% |
| Mixed: White and Black African | 0.1% | 0.2% | 0.3% | 0.1% | 0.4% | 0.2% | 0.4% |
| Mixed: White and Asian | 0.6% | 1.2% | 0.9% | 0.4% | 0.4% | 0.6% | 0.8% |
| Mixed: Other Mixed | 0.6% | 1.2% | 1.4% | 0.6% | 0.4% | 0.7% | 0.8% |
| Asian or Asian British: Indian | 1.6% | 8.2% | 4.0% | 4.2% | 0.8% | 2.8% | 7.3% |
| Asian or Asian British: Pakistani | 0.7% | 3.8% | 2.7% | 1.0% | 0.8% | 1.1% | 2.4% |
| Asian or Asian British: Bangladeshi | 0.3% | 2.1% | 2.6% | 0.6% | 1.4% | 0.7% | 2.2% |
| Asian or Asian British: Other Asian | 0.6% | 2.1% | 1.4% | 1.7% | 1.6% | 1.1% | 2.2% |
| Black or Black British: Caribbean | 1.1% | 1.7% | 2.9% | 3.9% | 5.9% | 2.0% | 4.2% |
| Black or Black British: African | 0.6% | 3.1% | 4.3% | 3.9% | 3.9% | 1.9% | 5.6% |
| Black or Black British: Other Black | 0.9% | 3.1% | 3.1% | 4.0% | 3.1% | 2.0% | 0.7% |
| Chinese or Other Ethnic Group: Chinese | 0.3% | 1.3% | 0.4% | 0.4% | 0.4% | 0.4% | 1.8% |
| Chinese or Other Ethnic Group: Other Ethnic Group | 1.1% | 3.5% | 4.1% | 2.0% | 2.5% | 1.7% | 2.3% |
| Not known | 0.3% | 4.1% | 1.2% | 4.3% | 1.6% | 1.6% | - |
| Base | 33,322 | 2,892 | 4,442 | 14,217 | 255 | 55,129 | 5,058,900 |
| Source: MPS Workforce Information (2010) | |||||||
Appendix 1B
Highlevel commentary on workforce and population comparison
1. Appendix 1A reveals the similarities and differences between ethnic identity within the workforce representation and the London population. The representation level of the White group within the police exceeded the working age London population by around 22% percent points (i.e. 90.6% by comparison to 68.5%). The Asian community was about one-fifth the size of the London population at 3.3% compared to 14.1%. Within the Asian community, the Pakistani community was closest to the London population (i.e. 0.7% workforce compared 2.4% population), followed by Indian (1.6% compared to 7.3%) and Bangladeshi (0.3% compared to 2.2%). The Chinese and other group was one-third the size of the London population at 1.4% compared to 4.2%. The Black community was around one-quarter the size of the London population at 2.6% compared to 10.5%. Within the Black community, the Black other, which included the Black British community, exceeded the London population at 0.9% compared to 0.7%. The Black African (0.6%) and Caribbean (1.1%) communities remained relatively low.
2. The special constabulary had a very ethnically diverse workforce, broadly similar to the London working population, with the Chinese and others (4.8%), Asian (16.3%) and Mixed (3.0%) communities being greater than the London populations. Within the Asian community, the Indian (8.2%) and Pakistani (3.8%) communities were greater, whilst the Bangladeshi (2.1%) community was broadly equivalent to the London population. The Black community had the lowest representation by comparison to the London population (i.e. 7.9% against 10.5%), the Black African (3.1%) and Black Caribbean (1.7%) communities were significantly lower than their respective working age London populations. Conversely, the Black other community (3.1%) exceeded the London population (0.7%).
3. The ethnic identity diversity amongst PCSOs remained reasonably good, with the White (69.4%), Chinese and others (4.5%) and Black (10.3%) communities being broadly equivalent to the London populations. Although the overall Asian community (10.7%) was slightly lower than the London population, the Pakistani (2.7%) and Bangladeshi (2.6%) communities were greater than their respective London populations. The Indian community was under-represented (i.e. 4.0% compared to a population of 7.3%).
4. The BME representation within the Police staff roles was lower than the London working age population (i.e. 23.3% compared to 31.5%). However, the representation level of the Black community was greater than the London population (11.8% compared to 10.5%). Within the Black community, the Black Caribbean community was slightly lower than its London population (3.9% compared to 4.2%), whilst the Black other community was greater than its London population (4.0% compared to 0.7%); the Black African community had the lowest representation (3.9% compared to 5.6%). The Asian community was about half the size of the London population (7.6% compared to 14.1%). Within the Asian community, the Indian (4.2%) and Pakistani (1.0%) communities were around half the size of their respective London populations (i.e. 7.3% Indian, 2.4% Pakistani); the Bangladeshi community had the lowest representation at around one-third the size of the London population (0.6% compared to 2.2%).
Appendix 2A
Male representation levels by ethnicity, gender and roles (end-December 2009)
| Ethnic group | Percent | Ratio | |||||||
|---|---|---|---|---|---|---|---|---|---|
| Police | Staff | MSC | PCSO | London | Police | Staff | MSC | PCSO | |
| White | 90.8% | 76.7% | 62.5% | 65.5% | 69.3% | 1.31 | 1.11 | 0.90 | 0.94 |
| White: British | 87.6% | 73.2% | 54.3% | 60.2% | 57.1% | 1.53 | 1.28 | 0.95 | 1.05 |
| White: Irish | 1.4% | 1.2% | 2.0% | 1.4% | 2.3% | 0.63 | 0.54 | 0.90 | 0.64 |
| White: Other White | 1.8% | 2.2% | 6.2% | 3.8% | 10.0% | 0.18 | 0.22 | 0.62 | 0.38 |
| Mixed | 1.7% | 1.1% | 2.8% | 3.9% | 2.7% | 0.63 | 0.42 | 1.05 | 1.44 |
| Mixed: White and Black Caribbean | 0.4% | 0.2% | 0.3% | 1.3% | 0.7% | 0.53 | 0.31 | 0.51 | 1.88 |
| Mixed: White and Black African | 0.1% | 0.1% | 0.1% | 0.3% | 0.4% | 0.30 | 0.23 | 0.23 | 0.72 |
| Mixed: White and Asian | 0.6% | 0.4% | 1.3% | 1.0% | 0.8% | 0.73 | 0.47 | 1.62 | 1.25 |
| Mixed: Other Mixed | 0.6% | 0.5% | 1.0% | 1.3% | 0.8% | 0.79 | 0.59 | 1.36 | 1.68 |
| Asian or Asian British | 3.5% | 7.4% | 17.9% | 13.9% | 14.2% | 0.24 | 0.52 | 1.26 | 0.98 |
| Asian or Asian British: Indian | 1.7% | 3.8% | 8.5% | 4.9% | 7.2% | 0.23 | 0.52 | 1.17 | 0.67 |
| Asian or Asian British: Pakistani | 0.8% | 1.4% | 4.5% | 3.8% | 2.5% | 0.31 | 0.57 | 1.80 | 1.55 |
| Asian or Asian British: Bangladeshi | 0.4% | 0.7% | 2.7% | 3.7% | 2.1% | 0.18 | 0.33 | 1.27 | 1.74 |
| Asian or Asian British: Other Asian | 0.6% | 1.5% | 2.2% | 1.4% | 2.3% | 0.28 | 0.65 | 0.94 | 0.62 |
| Black or Black British | 2.4% | 7.6% | 7.6% | 11.0% | 9.8% | 0.24 | 0.78 | 0.78 | 1.12 |
| Black or Black British: Caribbean | 1.0% | 2.1% | 1.6% | 2.8% | 3.6% | 0.27 | 0.56 | 0.43 | 0.76 |
| Black or Black British: African | 0.6% | 3.1% | 3.5% | 5.2% | 5.5% | 0.10 | 0.57 | 0.63 | 0.95 |
| Black or Black British: Other Black | 0.8% | 2.4% | 2.6% | 3.0% | 0.6% | 1.31 | 3.71 | 3.98 | 4.68 |
| Chinese or Other Ethnic Group | 1.4% | 2.1% | 5.0% | 5.0% | 4.0% | 0.35 | 0.54 | 1.24 | 1.24 |
| Chinese or Other Ethnic Group: Chinese | 0.3% | 0.3% | 1.4% | 0.5% | 1.8% | 0.16 | 0.15 | 0.78 | 0.29 |
| Chinese or Other Ethnic Group: Other Ethnic Group | 1.1% | 1.9% | 3.6% | 4.5% | 2.2% | 0.51 | 0.85 | 1.60 | 2.00 |
| Not known | 0.2% | 5.0% | 4.2% | 0.8% | |||||
| Total | 77.0% | 41.9% | 69.8% | 65.6% | 51.7% | 1.49 | 0.81 | 1.35 | 1.27 |
Source: MPS Workforce Information (2010)
AAppendix 2B
Female representation levels by ethnicity, gender and roles (end-December 2009)
| Percent | Ratio | ||||||||
|---|---|---|---|---|---|---|---|---|---|
| Police | Staff | MSC | PCSO | London | Police | Staff | MSC | PCSO | |
| White | 90.0% | 69.3% | 67.1% | 76.8% | 67.5% | 1.33 | 1.03 | 0.99 | 1.14 |
| White: British | 86.1% | 65.3% | 54.1% | 68.2% | 54.5% | 1.58 | 1.20 | 0.99 | 1.25 |
| White: Irish | 1.6% | 1.5% | 2.5% | 1.5% | 2.2% | 0.72 | 0.70 | 1.17 | 0.69 |
| White: Other White | 2.3% | 2.4% | 10.4% | 7.1% | 10.8% | 0.21 | 0.23 | 0.96 | 0.65 |
| Mixed | 2.4% | 1.9% | 3.3% | 4.2% | 2.9% | 0.82 | 0.66 | 1.15 | 1.44 |
| Mixed: White and Black Caribbean | 0.8% | 0.7% | 0.3% | 1.5% | 0.8% | 0.98 | 0.85 | 0.43 | 1.87 |
| Mixed: White and Black African | 0.2% | 0.1% | 0.3% | 0.3% | 0.5% | 0.41 | 0.29 | 0.74 | 0.68 |
| Mixed: White and Asian | 0.6% | 0.4% | 0.9% | 0.7% | 0.8% | 0.77 | 0.52 | 1.14 | 0.91 |
| Mixed: Other Mixed | 0.8% | 0.7% | 1.7% | 1.6% | 0.8% | 0.94 | 0.80 | 2.07 | 1.96 |
| Asian or Asian British | 2.7% | 7.7% | 12.5% | 4.8% | 13.9% | 0.20 | 0.55 | 0.90 | 0.34 |
| Asian or Asian British: Indian | 1.5% | 4.4% | 7.5% | 2.3% | 7.3% | 0.21 | 0.61 | 1.02 | 0.32 |
| Asian or Asian British: Pakistani | 0.5% | 0.8% | 2.4% | 0.6% | 2.4% | 0.22 | 0.32 | 1.01 | 0.26 |
| Asian or Asian British: Bangladeshi | 0.1% | 0.6% | 0.6% | 0.5% | 2.3% | 0.04 | 0.25 | 0.25 | 0.23 |
| Asian or Asian British: Other Asian | 0.6% | 1.9% | 2.1% | 1.3% | 2.0% | 0.29 | 0.97 | 1.05 | 0.64 |
| Black or Black British | 3.2% | 14.8% | 8.6% | 8.9% | 11.4% | 0.28 | 1.30 | 0.76 | 0.78 |
| Black or Black British: Caribbean | 1.4% | 5.2% | 1.9% | 3.1% | 4.8% | 0.29 | 1.09 | 0.41 | 0.65 |
| Black or Black British: African | 0.7% | 4.4% | 2.4% | 2.6% | 5.8% | 0.12 | 0.76 | 0.41 | 0.45 |
| Black or Black British: Other Black | 1.2% | 5.2% | 4.2% | 3.2% | 0.8% | 1.47 | 6.47 | 5.26 | 3.97 |
| Chinese or Other Ethnic Group | 1.4% | 2.6% | 4.6% | 3.5% | 4.3% | 0.32 | 0.61 | 1.06 | 0.81 |
| Chinese or Other Ethnic Group: Chinese | 0.2% | 0.5% | 1.1% | 0.1% | 1.9% | 0.12 | 0.25 | 0.61 | 0.03 |
| Chinese or Other Ethnic Group: Other Ethnic Group | 1.2% | 2.2% | 3.4% | 3.4% | 2.4% | 0.48 | 0.89 | 1.42 | 1.41 |
| Not known | 0.3% | 3.7% | 3.9% | 1.9% | |||||
| Total | 23.0% | 58.1% | 30.2% | 34.4% | 48.3% | 0.48 | 1.20 | 0.62 | 0.71 |
Source: MPS Workforce Information (2010)
Appendix 3
The next five years
Provisional recruitment diversity targets for the next five years
BME
| Role | 2010/11 | 2011/12 | 2012/13 | 2013/14 | 2014/15 |
|---|---|---|---|---|---|
| Police recruits | 19.6% | 25.0% | 30.1% | 31.5% | 31.5% |
| PCSO | 25.4% | 31.5% | 31.5% | 31.5% | 31.5% |
| Staff | 30.0% | 31.5% | 31.5% | 31.5% | 31.5% |
| Specials | 31.5% | 31.5% | 31.5% | 31.5% | 31.5% |
Female
| Role | 2010/11 | 2011/12 | 2012/13 | 2013/14 | 2014/15 |
|---|---|---|---|---|---|
| Police recruits | 35.0% | 40.0% | 45.3% | 48.3% | 48.3% |
| PCSO | 35.7% | 48.3% | 48.3% | 48.3% | 48.3% |
| Staff | 45.0% | 48.3% | 48.3% | 48.3% | 48.3% |
| Specials | 35.0% | 40.0% /td> | 45.0% | 48.3% | 48.3% |
Source: MPS Workforce Information (2010)
Projected strength diversity for next five years
BME
| Role | 2010/11 | 2011/12 | 2012/13 | 2013/14 | 2014/15 |
|---|---|---|---|---|---|
| Police | 9.6% | 10.0% | 10.5% | 11.1% | 11.6% |
| PCSO | 28.3% | 28.9% | 29.5% | 30.0% | 30.5% |
| Staff | 23.9% | 24.8% | 25.4% | 26.1% | 26.8% |
| Specials | 31.3% | 31.6% | 31.8% | 32.0% | 32.2% |
Female
| Role | 2010/11 | 2011/12 | 2012/13 | 2013/14 | 2014/15 |
|---|---|---|---|---|---|
| Police | 23.8% | 24.3% | 24.9% | 25.6% | 26.3% |
| PCSO | 34.3% | 34.8% | 35.2% | 35.6% | 36.0% |
| Staff | 56.7% | 56.1% | 55.7% | 55.3% | 54.9% |
| Specials | 31.8% | 33.6% | 34.2% | 35.1% | 36.0% |
Source: MPS Workforce Information (2010)
Appendix 4
Budgeted strength for next three years
Table 4: Budgeted strength for next three years
| Role | Projected 2009/10 | 2010/11 | 2011/12 | 2012/13 |
|---|---|---|---|---|
| Police /td> | 33,230 | 33,129 | 32,900 | 32,684 |
| PCSO | 4,685 | 4,716 | 4,716 | 4,716 |
| Specials | 3,347 | 5,330 | 6,667 | 6,667 |
| Police staff | 14,232 | 14,944 | 15,353 | 15,376 |
| Traffic wardens | 250 | 219 | 219 | 2219 |
| Source: Draft Budget and Business Plan (2009); MPA Workforce Information (2010) | ||||
Send an e-mail linking to this page
Feedback