Contents
Report 6 of the 18 March 2010 meeting of the Finance and Resources committee Committee, with the Treasury Management Strategy Statement and Investment Strategy.
- Treasury management strategy statement and investment strategy 2010/11
- Summary
- A. Recommendations
- B. Supporting information
- C. Race and equality impact
- D. Financial implications
- E. Legal implications
- F. Background papers
- G. Contact details
- Abbreviations
- Appendix 1: External Debt and Treasury Management Prudential Code Indicators 2010/11 to 2012/13
- Appendix 2: Arlingclose’s Economic and Interest Rate Forecast as at January 2010
Warning: This is archived material and may be out of date. The Metropolitan Police Authority has been replaced by the Mayor's Office for Policing and Crime (MOPC).
See the MOPC website for further information.
Treasury management strategy statement and investment strategy 2010/11
Report: 06
Date: 18 March 2010
By: Treasurer
Also presented at Resources and Productivity Sub-Committee - 1 March 2010
Summary
This report sets out the Treasury Management Strategy Statement and Investment Strategy recommended for 2010/11.
A. Recommendations
Members are invited to: Approve the 2010/11 Treasury Management Strategy Statement and Investment Strategy set out in this report
B. Supporting information
Background Information
1. The Chartered Institute of Public Finance and Accountancy’s (CIPFA) Code of Practice for Treasury Management in Public Services was revised in November 2009 in response to the financial crisis. The Code requires that the MPA adopts an annual Treasury Management Strategy Statement (TMSS) in advance of the year, and this report is submitted in accordance with that requirement. This statement also includes the Investment Strategy which is a requirement under the Communities and Local Government (CLG) Investment Guidance.
2. Furthermore the Local Government Act 2003 requires local authorities to have regard to CIPFA’s Prudential Code for Capital Finance in Local Authorities when setting and reviewing Prudential Indicators. Following a review in 2008 CIPFA issued a revised Code in November 2009. This statement incorporates recommended relevant treasury management indicators set out at Appendix 1.
Strategic Objectives
3. The MPA defines its treasury management activities as ‘the management of the organisation’s investments and cash flows, its banking, money market and capital market transactions; the effective control of the risks associated with those activities; and the pursuit of optimum performance consistent with those risks.”
4. While no treasury management activity is without risk the MPA regards the successful identification, monitoring and control of risk to be an important and integral element of its treasury management activities. The objectives underpinning the TMSS for 2010/11, and the area of risk that the objective will control, are as follows:
- To undertake treasury management operations with regard for the security of capital invested (Credit and Counterparty Risk)
- To ensure that sufficient cash is available such that the MPA is able to discharge its financial obligations in accordance with approved spending plans (Liquidity Risk)
- To minimise the cost of borrowing and to maximise the yield from investments consistent with the security and liquidity objectives identified above (Market or Interest Rate Risk)
- To minimise the amount of borrowing to be replaced at any one time by maintaining an evenly spread maturity profile (Refinancing Risk)
- To undertake treasury management activity with regard to Prudential Code Indicators (All areas of Risk)
Outlook for Interest Rates
5. Treasury management operations undertaken to meet the objectives set out at paragraph 4 must have regard to the prevailing economic climate. Since 2007 reports to this Committee have provided members with updates on the turbulence in the global banking and money market system from the first evidence of the credit freeze in the UK in 2007, through the extreme conditions following the collapse of Lehman Brothers in the USA, the freezing of Icelandic Bank assets and the substantial financial assistance provided by Central Banks and Governments, including the £200bn asset purchase facility implemented by the Bank of England.
6. The economic interest rate outlook provided by the MPA’s treasury advisor, Arlingclose, is attached at Appendix 2. While future interest rates will rise from the current very low position the timing and extent of rises will be determined by a range of economic and political variables. The MPA will continue to monitor evolving market conditions, the impact on interest rates and the consequences for treasury management activity.
The Investment Strategy
7. To comply with CLG’s guidance the MPA’s overriding objective is to invest its surplus funds prudently and to reduce risk in accordance with the strategic objectives set out above at paragraph 4. The guidance reiterates that security and liquidity must be the primary objectives of a prudent investment strategy and sets out criteria that identifies investments as either specified or non-specified.
Specified Investments
8. Specified investments offer high security and high liquidity and meet the CLG criteria set out below:
- The investment is sterling denominated
- The investment has a maximum maturity of one year
- The investment meets the high credit quality as determined by the MPA, or is made with the UK government or a local authority or a parish or community council
- The investment is not defined as capital expenditure, i.e. not loan capital or share capital in a body corporate
9. It is proposed that specified investments for use by the MPA are as follows:
- Deposits in the Debt Management Account Deposit Facility
- Deposits with other UK local authorities
- Deposits with banks and building societies
- AAA rated Money Market Funds with a Constant Net Asset Value (NAV)
10. In any period of significant stress in financial markets, the default position is for investments to be made with the Debt Management Office or with institutions that have Government support or have very high credit ratings. This has been the position adopted by the MPA (approved by Finance and Resources Committee in November 2008). At least 25% of investments have been with the DMO (low returns an acceptable trade off for the guarantee of capital security) and with institutions rated at least AA- (long term) and F1+ (short term) and with a sovereign rating of AAA. These criteria have provided a counterparty list of six institutions.
11. With the financial crisis focussing attention on the security of capital invested CLG, in their revised guidance, state that a specified investment is one made with a body or scheme of high credit quality (this is a revision from the previous guidance of a high credit rating).The MPA, with the guidance and assistance of treasury advisors Arlingclose, will continue to maintain a counterparty list based on high credit quality criteria and will monitor and update regularly the credit standing of institutions. This assessment will include credit ratings and other alternative assessments of credit strength as outlined below at paragraph 13.
12. Conditions in the financial sector have begun to show signs of improvement giving the MPA the opportunity of now diversifying its counterparty list but adopting the concept of high credit quality as recommended by CLG. Arlingclose have recommended that it is now appropriate to extend the counterparty list by considering non UK banks for investment. This position has been reached following analysis and monitoring of a range of criteria that together create an assessment of an institution’s, or a sovereign’s, credit quality.
13. The sovereign states whose banks are to be included are Australia, Canada, Finland, France, Germany, Netherlands and Spain. These countries, and the banks within them, have been selected after careful analysis and monitoring of the following:
- Credit ratings (minimum long term A+)
- Credit Default Swaps (CDS)
- Gross Domestic Product (GDP) and net debt as a percentage of GDP
- Support mechanisms, either from Central Government or a well resourced parent institution within a financial group
- Share price
These criteria include the criteria that KPMG recommended the MPA use in their review of treasury management considered by Finance and Resource Committee in February 2009.
14. The expansion of the counterparty list by 15 banks will provide additional opportunities for the placing of funds while meeting the requirement of the CIPFA Treasury Management Code, and the CLG, that the MPA is focussing on a range of indicators to determine high credit quality and is not considering credit ratings in isolation. The revised counterparty list is attached at Appendix 3.
15. Appendix 3 includes the proposed individual limit for each counterparty. These limits must provide sufficient opportunity to place funds particularly at the time of receipt of large scale grants and funding. The increased opportunities that will result in the spreading of risk amongst a wider range of institutions means that the individual limits for UK banks can be set at £30m, reduced from the 2009/10 limit of £50m. It is proposed that the individual limits for non UK banks are set at £20m with a sector limit of £100m.
16. The notional individual limit for the MPA banker RBS is also proposed to be £30m, in line with other UK banks, but is noted on Appendix 3 as having no counterparty limit. Occasionally very late receipts, such as the capital receipt from the sale of a building, will be received into the current account. Late funds cannot be placed elsewhere and will remain within RBS and a “no limit” assignment to RBS allows for this.
17. When placing surplus funds the investment decision is made with regard to cash flow requirements resulting in a range of short-term maturity periods. CLG guidance recommends that procedures are in place to determine the maximum periods for which funds may prudently be committed, with specific reference to funds committed for more than 365 days. In practice funds are placed very short term but it is nevertheless proposed that the MPA does not invest funds for more than 365 days and this will be reflected in the relevant Prudential Code indicator at Appendix 1.
18. The inclusion of Money Market Funds provides the MPA with access to pooled funds that invest in highly diversified and high credit quality investments. Arlingclose recommend a number of AAA rated money market funds that will provide security, high liquidity and a return commensurate with high security and liquidity. Arlinglose currently recommend seven of these AAA rated funds and the MPA will consider these for placing funds with an individual limit of £20m and a sector limit of £50m.
19. Although local authorities have been included as counterparties the MPA has placed only limited funds with this sector. It is not proposed to change this approach and if opportunities arise that match MPA requirements these will be considered. The counterparty limit assigned to a local authority is based on the authority’s budget.
Non-specified Investments
20. Non-specified investments do not, by definition, meet the requirements of a specified investment. These would include investments undertaken with mutual building societies that do not meet the specified criteria above or investments that have a maturity greater than one year. It is proposed that the MPA does not undertake non-specified investments.
Summary of recommended changes to the investment strategy
21. To assist members Table 1 below provides the key components of the proposed 2010/11 investment strategy with a comparison to the 2009/10 strategy. The emphasis is to move away from reliance on the DMO by creating opportunities elsewhere. Although there is an increase in the number of non UK banks there is no guarantee that the selected banks will actively take funds in line with MPA requirements. Also money market funds tend to be low yielding but should provide at least a small marginal return over that received from DMO deposits. The most significant opportunities are likely to be call accounts with UK banks that will provide a relatively attractive return and offer liquidity.
22. Short term money markets are likely to remain at very low levels, clearly having an impact on investment income. However looking at prevailing opportunities it is estimated that the benefit of placing funds in UK bank call accounts, and not with the DMO, will be approximately £0.4m a year.
Table 1: Summary of 2009/10 and proposed 2010/11 investment strategy
| Investment criteria | 2009/2010 Strategy | 2010/2011 Proposed |
|---|---|---|
| Maximum Term | 3 months | 1 year |
| Debt Management Office (DMO) | Average 25% of portfolio | No prescribed amount |
| Long term (1 year +) | None | None |
| Building Societies (Non specified) | None | None |
| Credit Ratings: | L/T S/T Individual | L/T S/T |
| Fitch | AA- F1+ C | A+ F1 |
| Moody’s | Aa3 P-1 C- | A1 P-1 |
| S&P | A+ A-1 | |
| Sovereign | AAA | AA+ |
| Counterparty Limit (UK) | £50m | £30m |
| Counterparty Limit (Non UK) | Individual £20m Sector £20m | Individual £20m Sector £100m |
| Money Market Funds | None | AAA rated |
Borrowing Strategy
23. Resources and Productivity Sub-Committee of 11 January 2010 and Finance and Resources Committee of 21 January 2010 approved a borrowing strategy which included estimated new external borrowing of £50m in Quarter 4 2009/10 and outlined further borrowing to be undertaken in 2010/11.
24. It is confirmed that new borrowing of £50m, in fixed rate maturity loans, was undertaken in Quarter 4 2009/10. With the repayment of one maturity loan in March 2010, the level of external debt on 1 April 2010 will be £121.95m. (Against the 2010/11 operational boundary prudential code indicator of £303m).
25. Members are reminded that the seven year borrowing and capital spending plan confirmed the borrowing element that supports the capital programme which (including the additional borrowing contingency of £60m approved in July 2009 to address the lack of capital receipts due to the depressed property market) is set out below at Table 2. The decision to take up £90m of external loans during 2010/11, or to fund from internal sources, is driven by cash flow. The current cash flow forecast, which includes provision for capital expenditure as set out in the capital programme, is that external borrowing to support the cash position will need to have been undertaken by December 2010 / January 2011.
Table 2: Borrowing (Supported and Unsupported) to Fund the Capital Programme
| 2009/10 £m |
2010/11 £m |
2011/12 £m |
2012/13 £m |
2013/14 £m |
2014/15 £m |
|
|---|---|---|---|---|---|---|
| Borrowing | 54.8 | 40 | 40 | 40 | 40 | 40 |
| Additional contingency | 0 | 50 | 10 | 0 | 0 | 0 |
| Total | 54.8 | 90 | 50 | 40 | 40 | 40 |
26. During 1st quarter 2010/11 cash flow estimates and estimated future interest rates, will be closely monitored prior to the anticipated increase in PWLB rates expected during quarters 3 and 4 of 2010/11. It will be advantageous to schedule any new loans before anticipated rate increases even though the cash flow requirement may be later in the year. It is permissible under the prudential code to borrow in advance of need (up to the level of the Capital Financing Requirement (CFR)) with the cash forming part of invested balances until the related capital expenditure is incurred.
27. Upward pressure on long term interest rates will also be aided by the Bank of England’s decision not to extend the quantitative easing programme beyond the current £200bn for the time being. This will add greater importance to the timing of 2010/11 external borrowing. This will be closely monitored by MPS Treasury team, the Treasurer and Arlingclose. It is therefore proposed that new external borrowing of £90m is approved, with the timing of borrowing determined by the factors discussed above.
Treasury Management Prudential Code Indicators
28. The Prudential Code has a key role in capital finance decisions with objectives that ensure capital investment plans are affordable, prudent and sustainable. The prudential indicators specific to treasury management are designed to ensure that treasury management is carried out in accordance with good professional practice. Prudential Code Indicators are set out in Appendix 1.
C. Race and equality impact
Consideration is given to the requirements of the Race Relations (Amendment) Act through the MPA/MPS Environmental Strategy and the developing Ethical Investment Policy whereby best practice standards are promoted.
D. Financial implications
The proposed strategy for 2010-11 increases opportunities for the placing of funds away from the DMO; this is expected to increase potential interest receipts by £0.4m. Income budget for 2010-11 is £0.8m.
E. Legal implications
1.Under Section 1 of the Local Government Act 2003, the MPA as local authority defined under s23 of that Act, may borrow money for any purpose relevant to its functions under any enactment, or for the purpose of the prudent management of its financial affairs.
2.The Mayor is required under s3 of the Local Government Act 2003 to determine how much money the GLA and each functional body (which includes the MPA) can afford to borrow. In complying with this duty, Regulation 2 of the Local Authorities (Capital Finance and Accounting)(England) Regulations 2003 requires the Mayor to have regard to the Prudential Code for Capital Finance in Local Authorities when determining how much the MPA can afford.
3. The MPA’s standing orders provide the Treasurer, as the s127 officer, is responsible for the proper administration of the MPA’s financial affairs. Part F of the MPA’s standing orders also requires the Treasurer to report to the Authority, or designated committee of the Authority, on treasury management operations on a quarterly basis.
4. As is indicated in para 1 of section B an investment strategy statement must be completed as part of risk management and good Governance . The report is submitted in compliance with TMSS and CLG requirements in this regard .
5. Any further legal implications relating to the proposed capital programme will be reflected in the final report to the Authority on the capital programme in March 2010.
F. Background papers
- Policing London 2009-12 Business Plan.
G. Contact details
Report author(s): Nick Rogers, Director of Group Finance, MPS
For more information contact:
MPA general: 020 7202 0202
Media enquiries: 020 7202 0217/18
Abbreviations
- CIPFA
- Chartered Institute of Public Finance and Accountancy
- TMSS
- Treasury Management Strategy Statement
- CLG
- Communities and Local Government
- NAV
- Net Asset Value
- DMO
- Debt Management Office
- CDS
- Credit Default Swaps
- GDP
- Gross Domestic Product
- RBS
- Royal Bank of Scotland
- PWLB
- Public Works Loans Board
- CFR
- Capital Financing Requirement
- ILMCS
- Inner London Magistrates Courts Service
- ILPS
- Inner London Probation Service
- EIP
- Equal Instalment of Principal
Appendix 1: External Debt and Treasury Management Prudential Code Indicators 2010/11 to 2012/13
The Prudential Code requires authorities to self-regulate the affordability, prudence and sustainability of their capital expenditure and borrowing plans, by setting estimates and limits, and by publishing actuals, for a range of prudential indicators.
Treasury Indicators within the Prudential Code
The following four indicators, which in the recent revisions of the Prudential Code and Treasury Management Code of Practice are now more appropriately linked to the Treasury Management Code, focus on the position for gross external debt.
1. Acceptance of the CIPFA TM Code
The MPA adopted the CIPFA Code of Practice for Treasury Management in the Public Services in March 2002.
2. Authorised Limit for External Debt
This is the maximum amount that the authority allows itself to borrow in each year and is measured against all external borrowing items on the balance sheet. The Treasurer reports that these Authorised Limits are consistent with the authority’s current commitments, existing plans and the proposals in the budget report for capital expenditure and financing. They are also consistent with its approved treasury management policy statement and practices. They are based on the estimate of the most likely, prudent but not worst-case scenario, with sufficient flexibility over and above this to allow for operational management, for example unusual cash movements. Risk analysis and risk management strategies have been taken into account, as have plans for capital expenditure and estimates of cashflow requirements.
| 2009/10 Original £000 | 2009/10 Revised £000 | 2010/11 Estimate £000 | 2011/12 Estimate £000 | 2012/13 Estimate £000 | |
|---|---|---|---|---|---|
| Borrowing | 228,205 | 228,205 | 318,150 | 370,650 | 412,650 |
| Other Long Term Liabilities | - | - | - | - | - |
| Total | 228,205 | 228,205 | 318,150 | 370,650 | 412,650 |
These figures reflect the understanding that the borrowing needs of the Authority will be matched by the negotiation of external loans. Figures are calculated on a cumulative basis taking account of existing PWLB repayment schedules.
3. Operational Boundary for External Debt
The proposed Operational Boundary for external debt is based on the same estimates as the Authorised Limit but reflects directly the estimate of the most likely, prudent, but not worst case scenario, without the additional headroom included within the Authorised Limit to allow for example for unusual cash movements and equates to the maximum of external debt projected by this estimate.
As with the Authorised Limit the figures reflect the understanding that the borrowing needs of the Authority will be matched by the negotiation of external loans. Figures are calculated on a cumulative basis taking account of existing PWLB repayment schedules.
| 2009/10 Original £000 |
2009/10 Revised £000 |
2010/11 Estimate £000 |
2011/12 Estimate £000 |
2012/13 Estimate £000 |
|
|---|---|---|---|---|---|
| Borrowing | 217,338 | 217,338 | 303,000 | 353,000 | 393,000 |
| Other Long Term Liabilities | - | - | - | - | - |
| Total | 217,338 | 217,338 | 303,000 | 353,000 | 393,000 |
4. Actual External Debt (at start of financial year 2010/11)
This figure is taken directly from the MPA balance sheet and is the closing balance for actual gross borrowing plus any other long-term liabilities.
Actual External Debt, 1 April 2010 (£000): 121,950
Treasury Indicators within the TM Code
5. Interest Rate Exposures
The purpose of these indicators is to set ranges that will limit exposure to interest rate movement. The indicator required by the TM Code considers the net position of borrowing and investment and is based on principal sums outstanding, and these are set out below:
| 2009/10 Estimate | 2010/11 Estimate | 2011/12 Estimate | 2012/13 Estimate | |
|---|---|---|---|---|
| Upper limit on fixed interest rate exposures | 95% | 95% | 95% | 95% |
| Upper limit on variable rate exposures | 30% | 30% | 30% | 30% |
The upper limit on fixed rate exposure of 95% and variable rate of 30% on net principal sums means that fixed interest rate exposure can be managed within the 70% to 95% range and variable interest rate exposures within a 5% to 30% range.
To assist operational treasury management two discretionary local indicators have been selected
6. Gross Outstanding Borrowing
Limits in interest rate exposure calculated with reference to outstanding borrowing sums.
| 2009/10 Estimate | 2010/11 Estimate | 2011/12 Estimate | 2012/13 Estimate | |
|---|---|---|---|---|
| Upper limit on fixed interest rate exposures | 100% | 100% | 100% | 100% |
| Upper limit on variable rate exposures | 15% | 15% | 15% | 15% |
7. Gross Outstanding Investment
Limits in interest rate exposure calculated with reference to outstanding investment sums.
| 2009/10 Estimate | 2010/11 Estimate | 2011/12 Estimate | 2012/13 Estimate | |
|---|---|---|---|---|
| Upper limit on fixed interest rate exposures | 100% | 100% | 100% | 100% |
| Upper limit on variable rate exposures | 100% | 100% | 100% | 100% |
8. Maturity Structure of Borrowing – Upper and Lower Limits
The amount of projected borrowing that is fixed rate maturing in each period as a percentage of total projected borrowing that is fixed rate.
| Lower Limit % | Upper Limit % | |
|---|---|---|
| Under 12 months | 0 | 15 |
| 12 months and within 24 months | 0 | 15 |
| 24 months and within 5 years | 0 | 15 |
| 5 years and within 10 years | 0 | 40 |
| 10 years and within 20 years | 0 | 50 |
| 20 years and within 30 years | 0 | 50 |
| 30 years and above | 0 | 50 |
9. Principal sums invested for periods longer than 364 days.
The MPA will not consider the investment of sums for longer than 364 days.
Appendix 2: Arlingclose’s Economic and Interest Rate Forecast as at January 2010
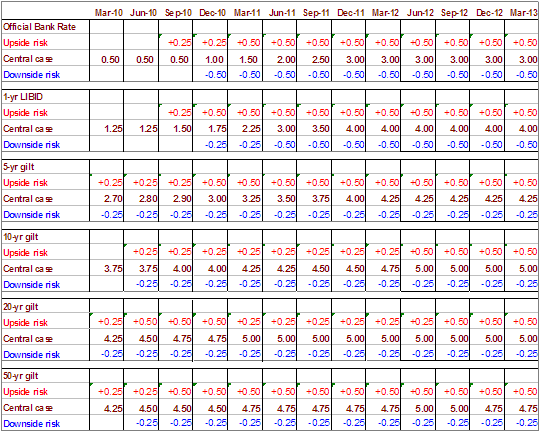
- The recovery in growth is likely to be slow and uneven, more “W” than “V” shaped. The Bank of England will stick to its lower-for-longer stance on policy rates.
- Gilt yields will remain volatile; yields have been compressed by Quantitative Easing and will rise once QE tapers off and if government debt remains at record high levels.
- The path of the base rate has been downgraded to reflect the fragile state of the recovering economy and the severe fiscal correction that will be coming post General Election that will dampen aggregate demand and cut household cashflow. Expectations of central bank exit strategies and their timing will increase volatility in sovereign bond yields and equities.
- There are significant threats to the forecast from potential downgrades to sovereign ratings and/or political instability.
Underlying assumptions
- The Bank of England’s Quantitative Easing (QE) program which injected £200bn to insure against the downside risks to growth and stimulate the economy officially ends 26 January. We estimate that QE has depressed gilt yields by around 70bs (0.7%).
- The Bank forecasts GDP to grow by 4% in 2011 but concedes growth could be impeded by corporate and consumer balance sheet adjustments, restrictions in bank credit and consumers’ cautious spending behaviour. This is an optimistic forecast in our view; evidence of recovery is scant with weak real economic data and rising unemployment. Q4 2009 grew by just 0.1%.
- Looming bank regulation and liquidity and capital requirements will curb bank lending activity. The Bank retains the option to reduce the rate on commercial banks’ deposits to encourage them to lend. But FSA regulations will force banks to buy more Gilts which could help slow the rise in yields in 2010/11.
- The employment outlook remains uncertain. Pay freezes, short hours, job cuts and a migration toward part time employment will continue into 2010 keeping the headline unemployment number down.
- Inflation is not an immediate worry for the Bank which forecasts CPI to rise due to higher commodity prices and VAT reverting to 17.5%. Commodity prices and VAT will push inflation over 3% prompting a letter from the Bank’s Governor to the Chancellor in Q1 2010.
- The UK fiscal deficit remains acute. Cuts in public spending and tax increases are now inevitable and more likely to be pushed through in 2010 by a new government with a clear majority, however a hung parliament cannot be ruled out and would be potentially disruptive to financial markets.
- The net supply of gilts will rise to unprecedented levels in 2010. Failure to articulate and deliver on an urgent and credible plan to lower government borrowing to sustainable levels over the medium term will be negative for gilts.
- The Federal Reserve Chairman Bernanke’s diagnosis of a weak U.S. economy and labour market signal that the Fed’s “extended period” of low rates may get even longer. The outlook for the Eurozone is more optimistic but the European Central Bank will only increase rates after a durable upturn in growth.
Supporting material
Send an e-mail linking to this page
Feedback