Contents
Report 8 of the 6 January 2011 meeting of the Communities, Equalities and People Committee, provides an update with regard to the MPS staff survey, Your Views Count. Results for 2008-09 and 2009-10 are presented.
Warning: This is archived material and may be out of date. The Metropolitan Police Authority has been replaced by the Mayor's Office for Policing and Crime (MOPC).
See the MOPC website for further information.
'Your views count' Metropolitan Police Service staff survey
Report: 8
Date: 6 January 2011
By: Director of HR on behalf of the Commissioner
Summary
This report provides an update with regard to the MPS staff survey, Your Views Count. Results for 2008-09 and 2009-10 are presented. Where appropriate, differences between business groups and demographic groups are highlighted. Actions that this MPS is progressing to address the findings are outlined, and recent changes to the survey for 2010-11 are also detailed.
A. Recommendation
That members
- Note the findings and information contained within the report.
B. Supporting information
Background
1. The MPS staff survey ‘Your Views Count’ was launched in August 2007 and has since been running on a continuous rolling basis. The survey is administered and analysed in partnership with Ipsos MORI, a recognised leader in the area of ‘market research’. This partnership enables the MPS to obtain access to valuable public and private sector benchmarking data.
Sampling
2. From 1st April 2010 the sampling method of ‘Your Views Count’ changed. Where previously only a selected number of employees from each (B)OCU were invited to participate, now all MPS employees are sent an invitation to complete the survey and share their views twice a year. This change to the sampling method was brought about in order to ensure that all employees have an equal opportunity to take part and, secondly, to increase the number of responses overall. It ensures that the results are more representative of the MPS and enables more robust analysis to be performed. In a further change to the sampling approach, every employee in a (B)OCU now receives their (email) invitation to complete the survey at the same time. This change has been made to allow communications to take place locally (led by SMT members) to encourage participation and boost overall response rates.
Driver model
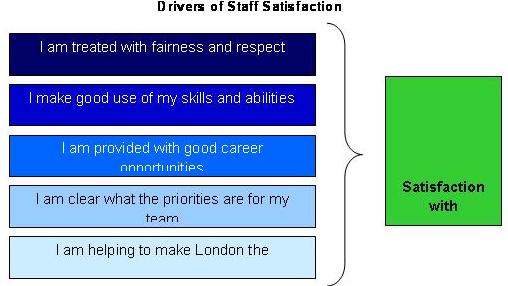
3. Research has shown that there is a positive correlation between employee satisfaction and performance i.e. more satisfied employees perform better. Therefore, in order to focus activity, the survey was assessed to identify the specific questions within the survey which were most influential on overall job satisfaction (survey item ‘I am satisfied with my current job’). Analysis identified five items that demonstrated a strong determining relationship, suggesting that an increase in these items would lead to an increase in satisfaction. These items (referred to as drivers) are presented in Figure 1. This model was drawn up on the basis of 6,000 responses obtained between April and August 2009 and it takes into consideration all demographic variables.
Figure 1: Drivers of staff satisfaction within the MPS
Overview of results: 2008-09 and 2009-10
4. 8378 MPS employees completed Your Views Count in 2008-2009, and 8943 in 2009-2010, equating to response rates of 29% and 18% respectively. The notable drop in response rates has sparked a range of action aimed at reversing this trend. Early indications from 2010-2011 suggest that this work is paying off and the response rate has increased to approximately 23%.
5. An overview of the results across all survey items is presented for 2008-2009 in Appendix 1 and for 2009-2010 in Appendix 2. Ipsos MORI public sector norm data is provided alongside MPS results in both appendices where such a benchmark is available.
6. The results show that across both financial years the results are remarkably consistent with agreement levels for 12 of the 23 items remaining static. There have been increases of up to 3% in relation to 4 items and, although 7 items have shown minor dips in agreement levels, these are a maximum of 1%.
7. For the 13 items where a public sector benchmark is available, the MPS exceeds the norm in 6 areas, matches it in 2 and does not yet meet it in 5.
8. In areas where the MPS does exceed the public sector norm, the difference is typically significant. To illustrate, significantly higher staff agreement levels are seen in relation to ‘In my team we take pride in delivering quality policing / outcomes’ (40% above the norm), ‘I make good use of my skills and abilities’ (25% above the norm), ‘I am encouraged to share my ideas and suggestions’ (16% above the norm) and I am trained to fulfill my current role (12% above the norm).
9. There are a small number of items that show agreement levels of under 60% (based on 2009-2010 data). These are;
- I am provided with good career development opportunities (37% agree)
- I am encouraged to share my ideas and suggestions (50% agree)
- I am given the equipment I need to do my job (49% agree)
- I have a healthy work-life balance (54% agree)
- I am treated with fairness and respect (55% agree)
- I am consulted on management decisions that affect me (34% agree)
Activity focused on improving the staff experience in these areas is detailed below within the section on action being taken to respond to survey results. It should be also be noted that for each of the above items in the region of a third of respondents indicated mixed views on the issue leaving a much smaller group who actually disagreed.
Demographic analysis
10. Respondents to the survey are invited to give their demographic information to enable issues of potential disproportionality to be explored where the sample size permits us to. Data is collected in relation to gender, ethnicity, religion, age, disability and sexual orientation. Employee type and business group details are also asked for. This data is monitored by the HR OD Team. Disclosure of this demographic data is voluntary and results are not reported when there is any risk that individuals may be identified. Staff are also given the option of ‘prefer not to say’. These rates are monitored as a helpful indication of staff confidence in disclosure and how this data will be managed by the organisation. Currently Sexual Orientation has the largest non-disclosure rate at 20%, followed by Religion at 18%, Ethnicity at 16%, Disability at 11%, and Gender and Age both at 8%. In some cases, size of the group who prefer not to disclose their demographic details is larger in size than the minority group. This needs to be addressed to provide reassurance that any differences seen between groups are real and not just due to the fact that we only know the demographics of a proportion of the sample. Ongoing work led by HR OD is focused on increasing the number of staff who choose to share personal data with the organisation in order to help us better understand our workforce, the presence of any disproportionality and deal proactively with any issues highlighted. This has seen use of the confidential screen rise from approximately 2200 in 2008 to approximately 9900 in 2010.
11. The most consistent finding in relation to diversity relates to disability where there is a disproportionate difference in the agreement levels of our disabled and non-disabled staff. To respond, the HR OD team are working in partnership with the Disabled Staff Association (DSA) and the Diversity and Citizen Focus Directorate (DCFD) to further explore the main areas of concern amongst disabled staff and managers, using Your Views Count data, existing DSA research, focus groups and 10,000v methodology. Interventions are also being developed to support managers around Deployment, Attendance Management, Progression, Development and Reasonable Adjustments, and FAQ’s for PeoplePages, SOP reviews and other targeted activity. Differences amongst groups within this diversity strand will continue to be monitored as these interventions are rolled out across the MPS.
12. In relation to the items of lower agreement detailed in paragraph 9 above, the following findings are worthy of note (based on the 2009-2010 data);
- Police officers demonstrate higher levels of overall job satisfaction than police staff colleagues
- Police staff demonstrate higher agreement levels in relation to having a healthy work-life balance, being given the equipment they need to do their job and being consulted on management decisions in comparison to police officers
- Black members of staff have significantly higher agreement levels than their white colleagues in respect of being given the equipment required to do the job, feeling consulted on management decisions, being kept informed of developments and helping to make London the safest major city in the world.
- Female members of staff have significantly higher agreement levels than male colleagues in respect of feeling that they are treated with fairness and respect, having a healthy work-life balance, feeling consulted on management decisions and feeling encouraged to share their ideas and suggestions.
- Male staff demonstrate higher overall job satisfaction when compared to women
13. At the current time, no analysis is performed on the demographic variable of age due to the absence of a clear majority group.
14. Individual business group results are examined against the MPS average in order to examine where there is a pattern of results that fall significantly higher or lower. Based on the 2009-2010 data, SCD, DCP and HR all have at least 8 areas where local staff agreement levels are significantly higher than the MPS average and none where they are lower. SO have a number of items where agreement levels are significantly lower than the corporate average and these are already being addressed through local action plans.
Responding to issues raised: action plans
15. Each Business Group has an Action Plan in place in order to respond to the key staff experience issues raised within their business area. At the corporate level, these are coordinated by the HR Organisational Development (OD) Team on behalf of the Director of Human Resources. The HR OD Team also looks at cross cutting themes that, for example, may impact upon a specific demographic group of staff and leads on the corporate response to these issues.
16. Action planning going forward will be aligned to drivers of engagement (in line with the new model), the following paragraphs provide an overview of some of the activity that has taken place in response to previous survey findings. Actions relating specifically to Equality and Diversity Impact are covered in Section C.
17. As part of the Professionalism agenda, DAC Leadership and Learning has established a Professionalism Executive Board (PEB). This is a virtual bringing together of the Leadership and Learning portfolio with those of the Directorate of Professional Standards (DPS), OD, DCFD and Employment Relations. This will promote much closer working between these existing areas of business with the shared goal of delivering cultural change in support of the delivery of the MPS strategic objectives. The group will work in partnership with the Business Groups and relevant Staff Associations to respond to arising issues through targeted interventions on the basis of a single set of performance information.
18. TP has undertaken an overarching response to improving survey responses as part of the TP Performance Framework. Survey data is monitored at the quarterly strategic tasking meetings and is considered in relation to public/user satisfaction and confidence, and relationships are explored. In addition, Quarterly Key Performance Review meetings are used to unpick the data at the Borough-level, and improvement activity is tasked accordingly. The TP OD Team are supporting boroughs to explore survey findings, e.g. through focus groups and existing staff networks / forums, identify specific issues contributing to low/high staff satisfaction, and set up action plans to address issues and monitor progress. Good practice and organisational learning will be fed into the major TP change programmes, e.g. TP Development, to enable the design of new systems and processes to maximise staff satisfaction and productivity.
19. ‘I am clear on what the priorities are for my team’ and ‘In my team we take pride in delivering quality policing’ have shown consistently high agreement ratings at 81% and 84% respectively. Alongside this, the agreement rating for ‘I am helping to make London the safest major city in the world’ has increased significantly since survey launch and early indications show this trend is continuing into 2010-2011. These ratings reflect the messages cascading from the Commissioner, and Business Group work that continues to emphasise their staff’s contribution to safety and confidence.
20. ‘I am provided with good career opportunities’ is an area for further work, although the MPS organisation remains consistently in line with the public sector norm. The backdrop of a shrinking organisation over the coming years and the accompanying controls that are required on recruitment and promotion are likely to add to the challenge of activity in this area however a number of the SIP projects will create opportunities for staff through the new operating models being introduced. In addition, the Training SIP is looking holistically at the concept of more structured professional development domains for staff and the role of Heads of Profession. For high potential and under-represented groups, the Emerging Leaders Programme (ELP) and Promoting Difference activity continues to provide development for staff. Furthermore, various local activity is underway, for example, DPA are developing their induction process and DoI are piloting a database to capture the skills and capabilities of staff in order to enable developmental and career path planning.
21. The issue of communication is one that underpins a number of the items, including 3 of the areas that attract the lowest agreement levels (under 60%) specifically ‘I am kept informed of developments’, ‘I am consulted on management decisions that affect me’ and ‘I am encouraged to share my ideas and suggestions’. Significant amounts of work continue to be progressed within the organisation with the aim of improving our corporate and local communication processes. DPA now publish The Friday Update and Met Leaders on a regular basis. This is supplemented by business group news briefs and ‘live forum’ events. DoR also coordinate a staff suggestion scheme. More specifically, CO is improving communications across each OCU through the introduction of seminars to discuss corporate issues, priorities and the 5 P’s (Presence, Performance, Productivity, Professionalism and Pride). Feedback is sought on ways to improve communication, team meetings will be used, monthly agenda items are to be placed on SMT agendas, and the intranet site will include ‘Good news’ items linked to London Crime reduction and Q&A pages. OCU Newsletters and Achievements are being highlighted in SMT team briefings for all staff. One OCU is introducing a working party with published minutes, whilst another OCU is looking to produce a new DVD presentation. SO are running Command Days targeting 1,000 people across the OCU’s, informing staff of current developments and encouraging sharing of ideas and suggestions through workshops. The SO Senior Management meeting infrastructure is also being reviewed to encourage participants to share their ideas and suggestions.
22. The 2009-2010 agreement rating in relation to ‘I am treated with fairness and respect’ sits at 55% - 4% below the public sector norm group. However, business groups have responded immediately to improve results. HR are holding focus groups with OCU’s with the lowest agreement levels to explore issues in greater depth, and also with the highest to capture good practice, and SO are monitoring areas for improvement as part of the SO Leadership project. Expectations of conduct are being disseminated across all business groups in support of the Professionalism agenda and issues regarding improving the management of equality and diversity issues are fundamental to the Workforce and Working Culture strand of the MPS Equality and Diversity Strategy.
23. ‘I have a healthy work-life balance’ is a recognised area of challenge for the MPS given the nature of our core business and associated requirement for shift work, on-call etc. The issue of outstanding rest days is being examined in the run up to the Games and HR lead ongoing work under the broad umbrella of work-life balance, including stress management interventions and promotion of flexible working patterns which a significant number of staff now benefit from. This item has seen a 2% increase from 2008-2009 to 2009-2010.
Changes implemented for 2010-2011
Response rates
24. As outlined in paragraph 2, changes to the sampling methodology have been introduced in order to ensure the sample is as representative as possible and to facilitate efforts to increase overall response rates. All MPS staff are given the opportunity to complete the survey on a six monthly basis. In a further change, the invitation to staff to complete the survey now comes from the Commissioner. Early indications are that response rates are improving. This builds on previous work to encourage participation which included the regular publication of survey results to staff (there is now a link through People Pages), the introduction of an action planning process (with plans for future publication of plans) and a review and updating of content.
‘Hot Topics’ section
25. Following an appropriate embedding period, the content of the staff survey has been reviewed to ensure that it is fully fit for purpose in terms of driving action to improve the staff experience for all groups.
26. Business Groups were consulted as part of this review and, in acknowledging that the survey was designed to be a high level temperature check (rather than provide a detailed analysis), the message from most Business Groups was that the current survey items broadly covered the main staff experience areas. However, Business Groups advised that as a corporate tool the survey provided an opportunity to gather feedback on current organisational issues e.g. the 5 Ps. In addition, there were requests to include a small number of business group specific items. Earlier this year, Management Board agreed the inclusion of a ‘hot topic’ section, which would include a small number of corporate and business group bespoke items that could be altered on a regular basis in line with business need. The content of this section is currently under development in consultation with the Business Groups.
Employee engagement
27. At the start of the 2010-2011 financial year, following agreement at Management Board, 15 new questions were added to the survey. These represented a shift in the focus of Your Views Count as together these questions make up a recognised model of employee engagement.
28. In the challenging post Comprehensive Spending Review operating environment that the MPS currently faces, and in line with the Commissioner’s clear messages to all staff to do ‘better with less’, it is critical that the MPS understands the experience of our staff and maximises the engagement of our workforce towards the deliver of safety and confidence.
29. A recent Government review and research by Ipsos MORI shows that public sector organisations with high employee engagement are also the organisations that are rated most positively by the public. The benefits of an engaged workforce are wide and varied but notably include;
- 78% of highly engaged public sector staff believe they can have an impact on service delivery or customer service (against only 29% of the disengaged)
- 70% of engaged employees indicate they have a good understanding of how to meet customer needs (only 17% of non-engaged employees say the same)
- Engaged employees in the UK take an average of 2.69 sick days per year; the disengaged take 6.19 days
- Engaged employees are 87% less likely to leave the organisation than the disengaged (Gallup, 2003)
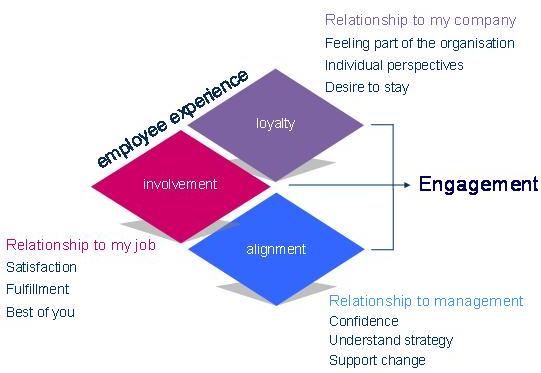
30. With a focus on ensuring sustained and enhanced staff productivity and the highest quality of service delivery for the public, employee engagement is a critical concept for senior MPS management to understand and influence. Ipsos MORI have developed a model of engagement based on data collected within hundreds of organisations and from thousands of employees. This model, presented in Figure 2, identifies three main constructs of engagement;
- Alignment - the relationship to senior management and goals of the organisation
- Involvement - motivation and fulfilment with current job
- Loyalty - the relationship to the organisation
This engagement model will be used for future reporting to examine MPS staff engagement levels and highlight key areas for improvement.
Figure 2: Ipsos MORI Engagement Model
Alignment to the 5 P’s
31. As part of measuring progress against the Commissioner’s 5Ps, a number of survey items are now contained within the corporate health indicators and other performance management frameworks. The survey has also been re-themed in alignment with the 5Ps.
C. Other organisational and community implications
Equality and Diversity Impact
1. Ongoing work focused on increasing the number of staff who choose to share personal data with the organisation in order to help us better understand our workforce, the presence of any disproportionality and deal proactively with any arising issues has been highlighted in Section B, paragraph 10.
2. Work to address manifesting disproportionality between our disabled and non-disabled members of staff is outlined in Section B, paragraph 11.
3. Results from Your Views Count form part of the performance pack in relation to the Workforce and Working Culture strand of the MPS Equality and Diversity Strategy This is reviewed by the Diversity Executive Board (chaired by the Deputy Commissioner) on a bi-monthly basis. Through the accompanying strand action plan, several areas of work are targeted at improving the experience for those staff in under-represented groups e.g. positive action for progression.
Consideration of MET Forward
4. Your Views Count directly supports the Met People strand of Met Forward. The MPS recognises that our people are our most important resource and to ensure that they are as productive as they can be and motivated to do the best for Londoners they must feel valued, supported and professionally led. Your Views Count enables Management Board to develop their understanding of the staff experience and respond in a targeted way in order to improve it.
Financial Implications
5. The cost of the staff survey contract held with Ipsos MORI is £42k for 2010-2011. This has reduced from 2009-2010 as the MPS has refocused and refined our service requirement. Any costs associated with undertaking action in response to findings are met from within existing business group budgets
Legal Implications
6. There are no specific legal implications arising from this report.
Environmental Implications
7. There are no significant environmental impacts arising from this report. However, it should be noted that the MPS Corporate Social Responsibility (CSR) strategy is currently awaiting review by the MPA. This strategy takes into account a broader scope of issues than the current MPS Environmental Strategy extending to social / ethical and economic issues. The action arising in response to Your Views Count findings has the opportunity to have a positive impact upon and ultimately improve MPS Corporate Social Responsibility performance around employee wellbeing, development and satisfaction.
Risk Implications
8. There are no specific risks to note.
D. Background papers
None
E. Contact details
Report authors: Alex Walsh, Strategic HR Director (Organisational Development) and Stuart Martin, HR Organisational Development Team, MPS
For information contact:
MPA general: 020 7202 0202
Media enquiries: 020 7202 0217/18
Supporting material
Send an e-mail linking to this page
Feedback